Download
1 / 25
250 likes | 421 Views
Water Supply Risk on the Colorado River: Can Management Mitigate? . Kenneth Nowak University of Colorado Department Civil, Environmental and Architectural Engineering and Center for Advanced Decision Support for Water and Environmental Systems (CADSWES). Co-Authors.

E N D
Water Supply Risk on the Colorado River: Can Management Mitigate? Kenneth Nowak University of Colorado Department Civil, Environmental and Architectural Engineering and Center for Advanced Decision Support for Water and Environmental Systems (CADSWES)
Co-Authors • Balaji Rajagopalan - CEAE, CIRES • James Prairie - USBR, Boulder • Ben Harding - AMEC, Boulder • Marty Hoerling - NOAA • Joe Barsugli - CIRES,WWA,NOAA • Brad Udall - CIRES,WWA,NOAA • Andrea Ray - NOAA
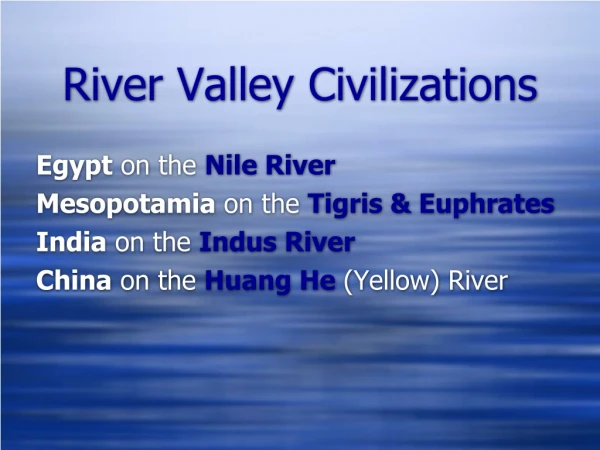
Colorado River Basin Overview 7 States, 2 Nations Upper Basin: CO, UT, WY, NM Lower Basin: AZ, CA, NV Fastest Growing Part of the U.S. 60 MAF of total storage 4x Annual Flow 50 MAF in Powell + Mead Irrigates 3.5 million acres Serves 30 million people Colorado River Compact 1922 Apportionment Source: US Bureau of Reclamation
Recent Drought and Reservoir Conditions Source: US Bureau of Reclamation • Significant storage decline • Shortage EIS policies New York Times Sunday Magazine, October 21, 2007
Below average flows into Lake Powell 2000-2004 62%, 59%, 25%, 51%, 51%, respectively 2002 at 25% lowest inflow recorded since completion of Glen Canyon Dam Recent Conditions in the Colorado River Basin Paleo Context Colorado River at Lee’s Ferry, AZ 5 year running average
Runoff and Elevation 6.5 Source: Udall 2009
Climate Change Projections for CRB • Changes in flow [~50 year horizon] Source: Ray et al., 2008
Net Inflow Sensitivity Defined as long-term mean flow minus the long-term mean of consumption plus evaporation/infiltration Current net inflow Range, “selected mean” Climate projections Results With 20% Reduction 50% Chance Live Storage Gone by 2021 Is that so? When Will Lake Mead Go Dry?Scripps Institution of Oceanography, 2008
Water Budget Corrections No inflow below Lee’s Ferry Static 1.7 (MAF/yr) ET/bank loss term No shortage policy included New study corrects these issues and frames problem as shortage needed to protect 1000’ at Lake Mead Results show that by mid century, high probability of not meeting full demand in order to protect 1000’ at Lake Mead Intuitive based on intersection of growing demand and decreasing flow Probability of shortage results fairly consistent with modeling in EIS based on variety of hydrology datasets Sustainable water deliveries from the Colorado River in a changing climateScripps Institution of Oceanography, 2009
Our Simple Water Balance Model • “Lump Bucket Model” • Storage in any year is computed as: Storage = Previous Storage + Inflow - ET- Demand • Colorado Basin current demand = 13.5 MAF/yr (shortage EIS depletion schedule) • Total live storage in the system 60 MAF reservoir • Initial storage of 30 MAF (i.e., current reservoir content) • Inflow values are natural flows at Lee’s Ferry, AZ + local flows between Powell and Mead and below Mead • ET computed using lake area – lake volume relationship • Transmission losses ~6% of releases accounted for
Streamflow Data • 10,000 traces, 50 years in length • Generated using Non-Homogeneous Markov technique (Prairie et al., 2008) • Combines paleo-reconstructed state information with observed flow values • Climate change induced reductions in flow • 3 scenarios explored; 0, 10 and 20% linear reduction trend applied to synthetic data over 50 year horizon
Management Alternatives • Alternatives consist of three components • Rate of demand growth • Shortage policy • Initial reservoir storage • Interim EIS shortage policies employed through 2026 • Current depletion schedule vs. slowed depletion schedule • Variety of shortage policies; action threshold and magnitude
Risk of Live Storage Depletion • 5 Alternatives examined • Near-term risks relatively low • Management can offer risk mitigation • Climatic regime largest factor
Mean Delivery Deficit Volume • “Deficit” any time full demand is not met • Average value by which demand is not met in a 50 year period (not per year) • (a) 20% flow reduction, (b) 10% flow reduction • Median values fairly similar across alternatives • Alternative E reduces std. dev. by 25% in (a) and by 35% in (b) • May be desirable for stakeholders
Current Basin Consumptive Use • 20% flow reduction trend, same management alternatives • Current demand based on EIS depletion schedule (left) ~13.5 MAF • Current demand based on estimated current consumptive use (right) ~12.7 MAF [source: USBR] • ~6% reduction in current demand results in ~37% risk reduction in 2058
Conclusions and Discussion Points • Interim period offers relatively low risk window to develop management strategies to mitigate water supply risk • Actual risk profile most likely lies between those from 12.7 and 13.5 MAF current demand • Climate projections contain uncertainty • Majority of streamflow originates at elevations above 9,000 ft • To assess threat to specific system components, full CRSS model run required
2 1.5 ET (MaF) 1 0.5 0 0 10 20 30 40 50 60 70 Storage (MaF) Combined Area-volume RelationshipET Calculation ET coefficients/month (Max and Min) 0.5 and 0.16 at Powell 0.85 and 0.33 at Mead Average ET coefficient : 0.436 ET = Area * Average coefficient * 12
Upper Basin Consumptive Use • Does not include UB reservoir evaporation
Generate system state Generate flow conditionally (K-NN resampling of historical flow) Streamflow Generation Framework (Prairie et al., 2008, WRR) Nonhomogeneous markov chain model employing observed & paleo data Natural climate variability 10,000 simulations, each 50-years long (2008-2057) Superimpose climate change trend (10% and 20%) Climate Change
CRB Flow Production Source: Hoerling 2008
Annual Lee’s Ferry Streamflow Source: Hoerling 2008
Model Validation – Interim Period • Black line is CRSS probability of operating under shortage conditions based on 125 paleo-conditioned traces • Green line is our model probability of operating under shortage conditions based on 10,000 paleo-conditioned traces • Red line is our model probability of operating under shortage conditions based on 125 randomly selected paleo-conditioned traces • Validation limitations of lump model – individual reservoir conditions can not be compared