Download
1 / 12
120 likes | 203 Views
Linkage in selected samples. Manuel Ferreira QIMR. Boulder Advanced Course 2005. Which nonparametric linkage statistics to use? First, type-I error. Then, power. Influenced by ascertainment, measurement scale, normality. 2. How to estimate the type-I error empirically?

E N D
Linkage in selected samples Manuel Ferreira QIMR Boulder Advanced Course 2005
Which nonparametric linkage statistics to use? • First, type-I error. Then, power. • Influenced by ascertainment, measurement scale, normality. 2. How to estimate the type-I error empirically? Gene-dropping simulations.
Family ascertainment Random ascertainment Proband selection Concordant affected sib pairs Selective ascertainment Discordant sib pairs Mixture More complex
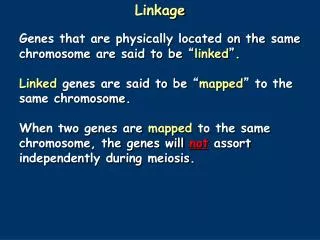
Nonparametric linkage statistics References for different Nonparametric linkage statistics Software implementing different Nonparametric linkage statistics Reviews Feingold 2002, Am J Hum Gen 71, 217–222 Posthuma et al 2003, Twin Research, 6, 361–376 Ferreira 2004, Twin Research, 7(5), 513–530
Correct type-I error (~0.05) Inflated type-I error (>0.05) HE: Haseman-Elston (SD, SS, CP, COM); VC: Variance Components; Mean IBD: Mean IBD sharing statistic; MERLIN-REG: Pedwide-regression analysis ("reverse regression"); VC-R: Reverse Variance components; NPL: Non Parametric Linkage Analysis that is based on IBD scoring functions; F&F: Forrest & Feingold composite statistic; VC-AC: Variance Components with ascertainment correction. Complex traits = nonparametric linkage analysis Sibships only: HE, Mean IBD, NPL, Composite
Assessing type-I error empirically Selected sample (proband selection), Continuous trait,Slightly non-normal (k=1.5) asthma.ped 1. Analyse your dataset merlin –d asthma.dat –p asthma.ped –m asthma.map --start:0 --grid:2 --vc --usecovariates
Assessing type-I error empirically 2. Generate replicate dataset with same phenotypes but unlinked genotypes Gene-dropping simulation merlin –d asthma.dat –p asthma.ped –m asthma.map --simulate --save -r $seed New Simulated Genotypic data 3. Analyse replicate dataset EXACTLY like the real dataset merlin –d replicate.dat –p replicate.ped –m replicate.map --start:0 --grid:2 --vc --usecovariates
Assessing type-I error empirically 4. Repeat 2 and 3 e.g. 1000 times (Shell script) 50% Point mass at zero and 50%
Assessing type-I error empirically 5. Estimate empirical genome-wide P value for peak LOD score P = proportion of replicates with a highest LOD score ≥ your peak LOD score e.g. LOD = 3.8, P = 20/1000 = 0.02 (Significant linkage, since < 0.05)
Assessing type-I error empirically 6. Estimate empirical genome-wide thresholds for suggestive and significant
Assessing type-I error empirically Genome-wide threshold for significant linkage (e.g. 3.7) LOD score that occurs by chance alone on average once per 20 scans Genome-wide threshold for suggestive linkage (e.g. 2.1) LOD score that occurs by chance alone on average once per scan
References for Gene-dropping simulations Kruglyak & Daly Am J Hum Genet. 1998 Apr;62(4):994-7 Abecasis et al. Am J Hum Genet 2004; 74: 403-417.