Download
1 / 23
240 likes | 410 Views
Unit 2 Research Methods. AP Psychology. The need for psychological science. Intuition and common sense – not in psychology!!! Hindsight bias – widespread “I knew it all along”; should’ve seen it coming Overconfidence – leads us to overestimate our intuition

E N D
Unit 2 Research Methods AP Psychology
The need for psychological science Intuition and common sense – not in psychology!!! Hindsight bias – widespread “I knew it all along”; should’ve seen it coming Overconfidence – leads us to overestimate our intuition Perceiving order in random events – we want to see correlations
The Scientific Attitude & Critical thinking Curiosity, humility & skepticism prepares us to think smarter Generalizability – to what degree the results of a study can be applied to different types of populations Critical thinking – smart thinking
The Scientific Method Hypothesis – (in psychology) a statement of relationships between or among variables. Psychologists generate statements after researching what other scientists have learned and observing variables in the environment. Then test it! Theories – generally highly researched, rigorously tested, framework that organize multiple studies under one umbrella of ideas; they are tested, not just questions
Operational Definitions & Replication Needs to be measurable and manageable Most important part of study; it defines what researchers will be observing & manipulating Experiments are more likely to be replicated effectively with clear operational definitions used The more a study is replicated, the more the findings can be applied to the general public. Generalizability of studies helps make them applicable to real world.
Description – case study & naturalistic observation Case study – one of oldest methods – Freud (Anna O.), Jung, Watson & Rayner (Baby Albert) Naturalistic observation & case studies – describing behavior, not explaining it – anthropology, sociology, zoology
Description - survey Random sampling usually generates representative sampling *Choosing participants *Taking a randomly chosen at random from larger sample & assigning population participants at random to *Chosen for many types either experimental or of research including control group surveys, interviews, *only applies to experiments experiments **Best basis for generalizing is from a representative sample of cases ***Representative samples represent the population ****percent of male & female participants should match between sample and population as well as racial/ethnic identity *****Always be critical of survey findings!!!*****
Correlation Scatterplots– plots are never perfect (scattered) How closely two things are related to one another Positive or Direct correlations – as one increases or decreases, so does the other Negative or Inverse correlations – as one increases, the other decreases Correlation coefficient - number represents strength of correlation; sign represents direction of correlation; -.70 is stronger than .65 Correlation does not mean Causation; tells you that they are related, not why they are related Correlation indicates possibility of cause-effect relations but does not prove causation Illusory correlations are often influenced by confirmation bias; we may notice random coincidences but forget they are random & instead see them as correlated Caution: media reports of experiments: are experiments actually experiments or correlations?
Experimentation • 2 main ways to group participants in a study: • 1. within subject design – comparing participants to themselves (pre-test v. post-test) • Less efficient but more resistant to effects of individual differences • 2. between subjects design – comparing one group of participants to another (most common set up) • Only one group (experimental group) sees independent variable • More efficient b/c you can conduct research in one sitting *Only type of study that can determine cause & effect is experimental *Do not assign causal conclusions for experiments only
Experimentation Random Assignment - often need 2 sample groups – can determine if its one factor or another Placebo Effect – health benefit from treatment by trusted source; can be used with any treatment not just drugs; treatment can help even if not finished
Variables • Independent variable Dependent variable • Manipulated variables What is measured • Its what researchers change The expected to make dependent variable outcome occur • Look for this 2nd Look for this 1st • What will cause DV What are they in this study?Looking for? Confounding variables – other factors that can possibly affect outcome of experiment -controlling for confounding variables is goal of experimental method -more controlled the environment, more likely you can tell if IV caused DV
Variables Reliability – consistency; retesting; e.g. SAT Validity – measure what’s supposed to measure versus outside norms e.g. SAT/PSSA/AP/school grades
Statistical Reasoning in Everyday Life • Types of Data: • Nominal Data – data that indentifies categories • e.g. gender, class level in school, yes/no survey answers • Interval Data – data falls within a number line & has a zero point • e.g. weight, height (no weight=0) • Ratio Data – data falls in number line where zero is just another number on the line • e.g. 0 degrees/test scores
Measures of Central Tendency Single score that represents whole set of scores Simplest yet most often confused type of basic statistics Central tendency refers to how the data measure the center of a set of data Mean, median and mode all point to where middle of data should be If mean, median, mode are all same #, graph of data will look like normal curve If mean, median mode are different, graph will be skewed or off center in some way Mean most susceptible to extremes in data – gets pulled up or down depending on extreme data points
Positive and Negative Skew Positive Skew – when scores pull mean towards higher end; the mean is more “positive” or greater than the rest of the scores Negative Skew – the opposite; the mean is pulled down towards lower end of scores
Standard Deviation Can tell how much scores deviate from one another Knowing standard deviation for a set of data can reveal how similar scores are – the higher the standard deviation, the less similar the scores are *AP test doesn’t usually test how to calculate standard deviation, but how to interpret it* **AP test tip – knowing percentage of scores that fall 1,2,3 standard deviations from mean is important for AP exam** For bell curve or normal curve – 68% is one standard deviation, 95% 2 standard deviations, 99.8% 3 standard deviations
Inferential Statistics Representative Samples are better than biased samples Less-variable observations are more reliable than those that are more variable More cases are better than fewer **Generalizations/anecdotes are unreliable**
Statistical Significance How 2 groups’ means are different If you graphed data from 2 groups & the the graphs did not overlap or only overlapped a little, the difference would be significant; if graphs overlapped a lot, the difference would not be significance Significance allows you to say how likely the difference in means is due to chance The usual goal is to get a significance level of .05 which says results are only 5% due to chance (or 95% due to your independent variable) Effect size (measure of strength of relationship between variables) – new way for researchers to report results; tells more about quality of data then significance along
Psychology Applied • General principles that help explain many behaviors most important • Psych studies have been criticized in past for using samples that are not representative of general public e.g. not including both genders or multiple cultures • Famous example: Kohlberg moral development
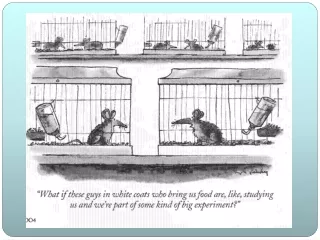
Ethics in Research APA ethics code requires that institutions that allow animal experimentation to take place establish an Animal Care and Use Committee to review whether studies done on animals follow ethical standards Milgram’s obedience and Zimbardo’s prison guard studies forced researchers to consider long term psychological effects on participants who may commit acts the didn’t realize they were capable of Confidentiality – keep participant info private; info may not be released and data must not be presented so individuals can be identified through any kind of process of elimination Anonymity – participating in study without providing identifying info; often helps participants respond more truthfully
Drs. Kenneth & Mamie Clark 1st psychological research cited in Supreme Court decision – black children prefer white dolls over black dolls Highlighted the importance of examining controversial and societal issues with scientific methodology