Download
1 / 15
150 likes | 219 Views
The economics of Asia Pacific Region countries: Malaysia, Thailand, Brunei. Malaysia economic indicators. Population – 24 mln.; Population growth rate– 1,78%; Age structure: 0-14 years: 32.6%; 15-64 years: 62.6%; 65 years and over: 4.7%. Sex ratio (male(s)/female): at birth: 1.07

E N D
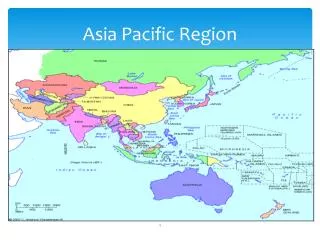
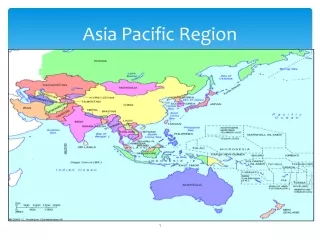
The economics of Asia Pacific Region countries: Malaysia, Thailand, Brunei
Malaysia economic indicators • Population – 24 mln.; • Population growth rate– 1,78%; • Age structure: • 0-14 years: 32.6%; • 15-64 years: 62.6%; • 65 years and over: 4.7%. • Sex ratio (male(s)/female): • at birth: 1.07 • under 15 years: 1.06 • 15-64 years: 1.01 • 65 years and over: 0.79 • total population: 1.01
Malaysia economic indicators • GDP (purchasing power parity): – $ 290 bln; • GDP - per capita (PPP) – $12 000; • Inflation rate (consumer prices) – 3%; • Unemployment rate – 3,6%; • Current account balance – $ 14 bln; • Debt - external – $ 52 mln.
Brunei economic indicators • рopulation – 379 mln.; • рopulation growth rate– 1,87%; • аge structure: • 0-14 years: 28.1%; • 15-64 years: 68.8%; • 65 years and over: 3.1%. • Sex ratio (male(s)/female): • at birth: 1.06 • under 15 years: 1.04 • 15-64 years: 1.12 • 65 years and over: 0.91 • total population: 1.09
Brunei economic indicators • GDP (purchasing power parity) – $ 6,8 bln (2003); • GDP - per capita (PPP) – $ 23 000 (2003); • GDP - real growth rate – 2% (2004) • Inflation rate (consumer prices) – 1 % (2003); • Unemployment rate – 5 % (2004); • Currency (code) – Bruneian dollar (BND).
Thailand economic indicators • Population: 65 mln people • Age structure: • 0-14 years: 22% • 15-64 years: 70% • 65 years and over: 8% • Sex ratio: • at birth: 1.05 male(s)/female • under 15 years: 1.05 male(s)/female • 15-64 years: 0.98 male(s)/female • 65 years and over: 0.84 male(s)/female • total population: 0.98 male(s)/female (2006 est.)
Thailand economic indicators • GDP (purchasing power parity):$560.7 billion (2005 est.) • GDP - per capita (PPP):$8,300 (2005 est.) • Population below poverty line:10% (2004 est.) • Inflation rate (consumer prices):4.5% (2005 est.) • Debt - external:$52.46 billion (2005 est.)
The most important exports-commodity • of Malaysia is electronics (since 1976); • of Brunei are crude oil and natural gas (2004); • of Thailand is textiles and footwear (2004).
Internet users of the countries • in Malaysia – 10 mln people(2005); • in Brunei – 56 000 people (2005); • in Thailand – 13 mln people (2005)