Download
1 / 34
350 likes | 465 Views
Performance Improvement: From Data to Action. Ron Bialek Jack Moran President Senior Quality Advisor Public Health Foundation Public Health Foundation. Objectives. By the conclusion of this User Call, participants will develop a better understanding of how to: Interpret Assessment Data

E N D
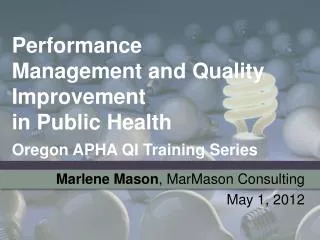
Performance Improvement: From Data to Action Ron Bialek Jack Moran President Senior Quality Advisor Public Health Foundation Public Health Foundation
Objectives By the conclusion of this User Call, participants will develop a better understanding of how to: • Interpret Assessment Data • Develop and Validate Priorities • Move from Priorities to Action • Discover Solutions • Integrate Evidence and Community Input
Jurisdiction Name Date Report Overview Types of Reports: • State PH System • Local PH System • Local Governance • Aggregate reports for statewide users • All locals or boards in state • State-local comparison
NPHPSP Reports (Example)How well did the system perform the ten EPHS? Summary of performance scores by Essential Public Health Service (EPHS)
NPHPSP Reports (Example)How well did the board perform the ten EPHS? • Rank ordered performance scores for each Essential Service, by level of activity
NPHPSP Reports (Example)How well did the board perform on specific areas? • Performance scores for questions within each Model Standard/ Essential Service
Jurisdiction Name Date NPHPSP Reports – Optional Assessments Optional Priority Rating Results (All 3 Assessments): What are potential areas for attention, based on the priority ratings and performance scores? Optional Agency Contribution Results (State and Local only): How much does the (Local Health Department/State Public Health Agency) contribute to the system’s performance, as perceived by assessment participants?
Priority Rating Results (Example) • Model Standard by priority and performance score, with areas for attention
Scatter plot of Model Standard scores and priority ratings Priority Rating Results (Example) • Quadrant I (High Priority/Low Performance) ─ May need increased attention • Quadrant II (High Priority/High Performance) ─ May be important to maintain efforts • Quadrant III (Low Priority/High Performance) ─ May shift or reduce some resources or attention to focus on higher priority activities • Quadrant IV (Low Priority/Low Performance) ─ May need little or no attention at this time
Priority Rating vs. Performance • Quadrant I ─ May need increased attention • Quadrant II ─ May be important to maintain efforts • Quadrant III ─ May shift or reduce some resources or attention to focus on higher priority activities • Quadrant IV─ May need little or no attention at this time Source: NPHPSP User Guide
NPHPSP Reports (Example)How well did the system perform on specific model standards Summary of performance scores by Essential Public Health Service (EPHS) and model standard
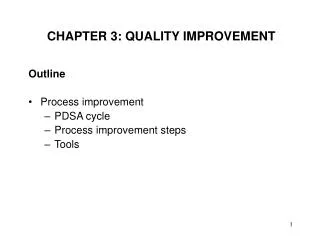
PDCA Cycle PDCA Cycle Plan Plan changes aimed at improvement, matched to root causes Do Carry out changes; try first on small scale Check See if you get the desired results Act Make changes based on what you learned; spread success Also called Plan-Do-Study-Act (PDSA), PDCA, PDCA Cycle, or Shewhart Cycle
Plan–Do–Check–ActExpanded in 7 Steps • Select the problem or improvement opportunity • Describe the current process • Describe all of the possible causes of the problem, and agree on the root cause(s) to address • Develop a workable solution and action plan, including targets or measures to know if the change is an improvement Plan
Plan–Do–Check–ActExpanded in 7 Steps • Implement the solution or process change • Review and evaluate the result of the change • Reflect and act on learnings Do Check Act
Problem Solving – What We Usually See Is The Tip Of Iceberg – “The Symptom” The Symptom The Root Causes Invisible Hidden
Root Cause Analysis • Root Cause is usually hidden and not obvious • Need to gather evidence – hear the “VOP” • Many tools: • 5 Whys • Pareto Chart • FMEA • Iterative process to get beyond the symptom of the problem • If we correct or eliminate the root cause we make real progress
NPHPSP Reports (Example)How well did the system perform on specific model standards Summary of performance scores by Essential Public Health Service (EPHS) and model standard
Motivation/Incentives People Necessary leadership not involved No reward for CHP at state and federal levels No money budgeted for CHP Partners do not understand importance of CHP Lack of clear direction Low priority in organizing CHP Takes time away from billable care Complicated or no IT system for reporting Lack of participation from partner organizations in data collection and use of CHP No experts or outside consultants to advise Lack of expertise on how to use and develop CHP Providers do not care if they report data in a timely fashion Staff not evaluated on CHP Lack of training for the staff about CHP Community partners do not see themselves as part of public health system Lack of outreach and education by public health agency Staff not hired with expertise No feedback on reporting No Regular Community Health Profile (CHP) Never see how data are used in reports Too many types of reporting systems (fax, email, paper) No standardized format for data presentation Data requests get lost or slow in reaching necessary people Frequent system errors System outdated -still uses DOS platform Poor presentation and interpretation of data for community stakeholders and partners Lack of standardized procedures for reporting and collecting data Difficult to use computer system to enter data for health assessment. Difficult to generate information for health assessment Few people trained to use the system Provider reporting methods inconsistent for diseases and events Paper forms for data request too long Still working with an incomplete document template for organizing into CHP No QA process for data reports No system to check quality of data received Materials/Equipment Methods/Procedures Cause and Effect Diagram (p. 66)
5 Why’s of “Necessary Leadership Not Involved” Why? Why? Why? Why? Why?
5 Why’s of “Necessary Leadership Not involved” Do not understand its Importance Why? Complicated Why? No training in how to do it Why? Not a priority Why? No Time/Money Why?
Flow Charts Symbols • Breaks a process down into tasks and decisions points. • Places symbols on a flow line in chronological order to represent the process steps. Beginning or end Activity symbol Flow line Decision symbol
Flow Chart Purpose: Start • Provides documentation • Examines relationships among process steps • Uses recognizable symbols Process Step No Decision Yes End
What Is A Flow Chart • A picture of a process’ inputs, actions, and outputs • Inputs are the factors we use to produce our products or services. Examples of inputs are materials, labor, equipment and management. • Actions are the way in which the inputs are combined and manipulated in order to add value. Actions include procedures, handling, storage, transportation and processing. • Outputs are the products or services created by acting on the inputs. Outputs are delivered to the customer/client or other user. Outputs also include unplanned and undesirable results, such as scrap, rework, pollution, etc
Sample Flow Chart 1.1.2 Community Health Profile Start Develop Manual To Electronic Process Electronic Format? No Collect Data Develop Data Source Yes Data Available? Integrate Into CHP No Determine How To Access Yes Remaining Process Steps Data Accessible? No End Yes
Standardization • How do you hold the gains from PDCA? • Use the SDCA Cycle • Stabilizes a process. • A stable process is: • measurable • predictable • controllable • Make new gains use PDCA again
Maintenance and Standardization • The maintenance and standardization phase of a process is how we hold the gains. • If our process is producing the desired results we standardize what we are doing.
Integrated Cycle PDCA/SDCA • The SDCA and PDCA cycles are not • separate but rather integrated. • Once we have made a successful • change we standardize and hold • the gain. • When the process is not performing • correctly we go from SDCA to PDCA • and once we have the process • performing correctly we standardize • again. • This switching back and forth between SDCA and PDCA provides us with the opportunity to keep our process customer/client focused.
Identifying Potential Strategies and Interventions • Evidence • Guidelines • Published articles • “Model” practices • Community • Perception is reality • Strategies have been tried • First things first
Helpful Resources • User Guide: Fall 2007 www.cdc.gov/od/ocphp/nphpsp/Documents/NPHPSPuserguide2004Apr.pdf • Guide to Community Preventive Services www.thecommunityguide.org/ • Healthy People 2010 Information Access Project phpartners.org/hp/ • NACCHO Model Practices www.naccho.org/topics/modelpractices/index.cfm • NPHPSP Online Resource Center www.phf.org/nphpsp/ • Public Health Infrastructure Resource Center www.phf.org/infrastructure/ • Public Health Memory Jogger II www.goalqpc.com/shop_products_detail.cfm?PID=754&PageNum_GetProducts=1&ProductShopBy=7
More Helpful Resources • Online QI Training – access course through TRAIN by searching for course ID #1014545 www.train.org • Multi-State Learning Collaborative QI Resources www.nnphi.org/mlc • PHF QI Learning Series Catalog www.phf.org/pmqi/PHF_QI_Learning_Series_082008.pdf
Thank you! For additional information on quality and performance improvement contact: • Jack Moran, Senior Quality Advisory, PHF: 202.218.4423; jmoran@phf.org • Ron Bialek, President, PHF: 202.218.4420; rbialek@phf.org • Jackie Carden, Associate Director for Performance Improvement, PHF: 202.218.4415; jcarden@phf.org