Download
1 / 44
490 likes | 866 Views
Generic Mapping Tools (GMT). The Basics plus Plotting in X-Y Space. Goal – make scientific illustrations. “Generic” is generic to the earth sciences community. Maps

E N D
Generic Mapping Tools (GMT) The Basics plus Plotting in X-Y Space
Goal – make scientific illustrations “Generic” is generic to the earth sciences community
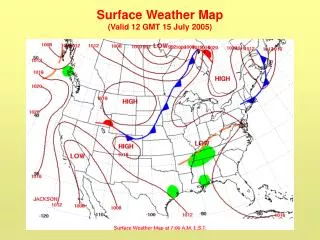
Maps • Color/bw/shaded topography and bathymetry, point data (earthquakes, seismic or gps stations, etc.), line data (faults, eq rupture zones, roads), vector fields w/ error ellipses, focal mechanisms • 3D surface • Cross sections
What is GMT • GMT is an open source collection of ~60 tools for manipulating geographic and Cartesian data sets (including filtering, trend fitting, gridding, projecting, etc.)
What is GMT • Produces PostScript File (PS) illustrations ranging from simple x-y plots via contour maps to artificially illuminated surfaces and 3-D perspective views
What is GMT • GMT supports ~30 map projections and transformations and comes with support data such as GSHHS coastlines, rivers, and political boundaries • If it does not have a map projection you want: it is open source and UNIX. (i.e. you can do it yourself)
Design Philosophy • Follows the modular design philosophy of UNIX: • The raw data → processing → final illustration flow is broken down to a series of elementary steps • each step is accomplished by a separate GMT or UNIX tool.
Design Philosophy • Benefits: (1) only a few programs are needed (2) each program is small and easy to update and maintain (3) each step is independent of the previous step and the data type and can therefore be used in a variety of applications (4) the programs can be chained together in shell scripts or with pipes, thereby creating a process tailored to do a user-specific task
Maintained by Paul Wessel and Walter Smith (now at the University of Hawaii and NOAA respectively) • The GMT homepage is: gmt.soest.hawaii.edu
GMT documentation • Tutorial • Technical Reference and Cookbook (aka Manual) • both available on web (http://gmt.soest.hawaii.edu/) as HTML on line, PDF, PostScript
GMT documentation • UNIX “man” pages – available on web and also as standard man pages on local installation. • Entering GMT program/filter name all by itself, or certain errors in command specification (switches, not data) – dumps man page to standard error.
What does/can GMT do? • Filtering 1-D and 2-D data • simple processing • GMT is NOT a general Number Cruncher • output is reprocessed data
What does/can GMT do? • Plotting 1-D and 2-D data • points, lines (symbols, fill, geologic symbols on faults, etc.) • vector fields • 2-D images – grayscale and color, illumination • 3-D perspective of 2-D images • histograms, rose diagrams • text • focal mechanism beachballs
What does/can GMT do? • Data preparation • gridding, resampling, conversion • Contouring • data base: extraction, merge • cross sections • projection/map transformation (map sphere to plane) • output is reprocessed data • Bookkeeping and bunch of other stuff
GMT Output • 1-D ASCII Tables — For example, a (x, y) series may be filtered and the filtered values output. ASCII output is written to the standard output stream. • 2-D binary (netCDF or user-defined) grid files–- Programs that grid ASCII (x, y, z) data or operate on existing grid files produce this type of output. • Reports – Several GMT programs read input files and report statistics and other information. Nearly all programs have an optional “verbose” operation, which reports on the progress of computation. Such text is written to the standard error stream
GMT Output • PostScript – The plotting programs all use the PostScript page description language to define plots. These commands are stored as ASCII text. • If you are really ambitious, you can directly edit this file using vim…but in general, don’t. • Postscript is directly translated by line printers, Adobe Illustrator/Photoshop, ghostscript, ghostview. • I frequently use Illustrator to edit raw Postscript prior to using figures in papers, presentations, or posters
output is “PostScript” program– generally ascii text, but not too readable. (GMT files can get amazingly BIG) % Map boundaries % S 1050 1050 1050 0 360 arc S S 1050 1050 1074 0 360 arc S S 24 W S 1050 1050 1062 -135 -90 arc S S 1050 1050 1062 135 180 arc S S 1050 1050 1062 45 90 arc S S 1050 1050 1062 -45 0 arc S S 1050 1050 1062 -90 -90 arcn S S 2 W S [] 0 B % % End of basemap % S [] 0 B %%Trailer %%BoundingBox: 0 0 647 647 % Reset translations and scale and call showpage S -295 -295 T 4.16667 4.16667 scale 0 A showpage
Installation/Maintenance • Done for us by Mitch – THANKS. • Somewhat complicated, not for average user but can be installed on laptops • Setup – basic setup done for us (don’t have to define GMTHOME, path, etc. if use standard CERI .login and .cshrc files)
Installation/Maintenance • Some common data sets (GTOPO-30, ETOPO-5, Predicted bathy, etc.) are installed • “.gmtdefaults”(generic, is .gmtdefaults4 for version 4) file in your home or working directory. • if you’ve copied something from the tutorial or gotten a script from someone else and it comes out “funny”, the “default” settings may be the culprit.
Easiest way to get started • Find system with GMT already set up • Get working program (shell script) from someone else and modify (hack) it. • Lots examples in • Tutorial • available on www • available from your friends
Sources of operational parameters/job control • command line options/switches or program defaults • carried over from execution of previous commands • from your .gmtdefaults file • (first in working directory if exists, if ~exist, then in your home directory if exists, finally, system/program defaults)
Sources of operational parameters/job control Why a defaults file? - too many parameters to require setting all explicitly (powerful) - customize – can have different defaults in different directories
Basic GMT use • Most GMT programs read input from terminal (stdin) or files, and write output to terminal (stdout) (a few write to files). • To write output to files one can use UNIX redirection: GMTprogram switches >! outputfile GMTprogram input-file switches >! outputfile
Basic GMT use • Some GMT programs will accept input-file names, pipes and input redirection in lieu of stdin GMTprogram switches < input-file >> outputfile Someprogram | GMTprogram1 | GMTprogram2 >> outputfile
Basic GMT use • Some GMT programs will accept in-line input – reads whatever follows -- up to character string XXX -- as input. GMTprogram switches << END >> output-file .1 .1 .2 .2 END
Basic GMT use • Can also do with “command substitution”: GMTprogram switches << FIN >> output-file `someprogramswithches < input-file…` FIN • Some GMT programs require input-file names (usually if need more than one input file)
GMT and scripts • GMT commands, once installed, act much like regular Unix commands. • Generally, the commands are enacted within a shell script so that they may be combined with other unix commands such as awk. • Bash and csh are the most commonly encountered in academia and passing down GMT scripts is how much seismology gets illustrated
Use Comments! • Comments are very popular to ignore but if you don’t comment your script, 2 years later you may not remember what you were doing. • The spaces and blank lines make your script readable. While it may take more paper if you print it, it only takes two bytes to make new line or a space.
Example 1: PLOTTING in X-Y Space • psbasemap: Create a basemap frame • psxy: Plot symbols, polygons, and lines in 2-D • sample1d: Resampling of 1-D table data sets
1) We start by making the basemap frame for a linear x-yplot that should be 5 by 3 inches in size. The –J option selects the type of projection (there are 25 potential projections). X is linear projection. psbasemap–JX5i/3i
2) We want it to go from 0 to 100 inxand from0to 10 in y. Specified by the REGION (-R) option, which (in the usual form) is psbasemap-R0/100/0/10 –JX5i/3i
3) The plot should annotated every 20 in x and every 2 in y with annotation on the lower and right axes only. This is specified by the –B option (Border). psbasemap -R0/100/0/10 –JX5i/3i \ -Ba20g10/a2f1g2WSne a is for annotation spacing, 20 for x and 2 for y g is for grid spacing, 10 for x and 2 for y f is for frame, controlling the minor tick spacing in y only
4) The plot should be on portrait oriented paper (default is landscape) psbasemap -R0/100/0/10 –JX5i/3i -B10/2nSeW –P Since we will be adding more GMT script, we need to indicate this using the –K switch psbasemap -R0/100/0/10 –JX5i/3i -B10/2nSeW –K –P We can also specify exactly where on the page to place the plot psbasemap -R0/100/0/10 –JX5i/3i -B10/2nSeW \ –X2 –Y14 –K –P >! plot.ps
7) Create a dataset of numbers from 0 to 100, every 1 point, and use awk to calculate the square root of each point sample1d -I1 << END |\ nawk'{print $1, sqrt($1)}' >input.dat 0 100 END
8a) Read in the new dataset and plot a line. Use the –O flag to specify that this will be overlain within the boundaries of the previous gmt command psxyinput.dat–R –JX -K –O>>plot.ps
8b) Use the –W flag to specify the line psxyinput.dat –R –JX -W5t15_15 -K –O >> plot.ps The –W command can be quite complicated. In this example, the first 5 represents line width, the t signifies a dashed line, the 15_15 specifies the dash and space width More simply, -W1/0 is more common. This is a 1 pt solid line width in black. Or use –W5/255/0/0 which is a solid line, width of 5, color red.
9a) Overlay red triangles with green outlines on every 10 data points. -S flag specifies using symbols with the t representing a triangle. When the –S flag is used, -W becomes the line around the symbol. -G controls the color of the symbol. sample1d input.dat -I10 |\ psxy -R –JX -St0.2 -G255/0/0 -W5/0/255/0 -O >> plot.ps
9b) Where is the –K??? Because this is the last line of our script, the –K flag is left off. sample1d input.dat -I10 |\ psxy -R –JX -St0.2 -G255/0/0 -W5/0/255/0 -O >> plot.ps
Several common “gotchas” • no showpage (can see on screen, but does not print – actually prints a blank page) (have a –K in last GMT call) • showpage in middle of file (forgot the –K somewhere) – only get part of file on screen or in final print or get ghostscript error message. • Have header in middle of file (forgot –O somewhere), get ghostscript error message.
There are two other non-map-projected forms Logarithmic - add l (lower case letter L) after scale of axis you want logarithmic -JX4l/2
2) Power/exponential – add p and exponent after scale of axis you want exponential (can scale axes individually) -JX4p0.5/2
GMT Colors • Color is specified using Red/Green/Blue (RGB), HSV or Grayscale color Grayscale: WHITE=255 LTGRAY=192 VLTGRAY=225 EXTGRAY=250 GRAY=128 BLACK=0 RGB: RED=250/0/0 DKRED=196/50/50 BLUE=0/0/255 GREEN=0/255/0 YELLOW=255/255/50 ORANGE=255/192/50 PURPLE=255/50/255 CYAN=50/255/255 LTBLUE=192/192/250 VLTBLUE=225/250/250 LTRED=250/225/225 PINK=255/225/255 BROWN=160/64/32