Download
1 / 9
90 likes | 227 Views
School Board Budget FY2013-2014. Jeffrey Bourne, Chairman - 3rd District Donald Coleman, Vice Chairman - 7th District Glen Sturtevant - 1st District Kimberly Gray - 2nd District Kristen Larson - 4th District Mamie Taylor - 5th District Shonda Harris- Muhammed - 6th District

E N D
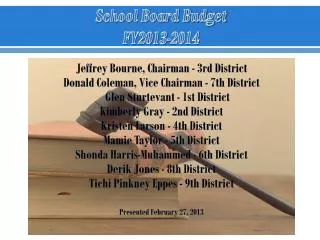
School Board BudgetFY2013-2014 Jeffrey Bourne, Chairman - 3rd District Donald Coleman, Vice Chairman - 7th District Glen Sturtevant - 1st District Kimberly Gray - 2nd District Kristen Larson - 4th District Mamie Taylor - 5th District Shonda Harris-Muhammed - 6th District Derik Jones - 8th District TichiPinkneyEppes - 9th District Presented February 27, 2013
Factors Impacting the Budget • FY2013-2014 • Revenue Shortfalls • Salary/VRS 1% Implementation • Salary Increase 1% • No Furlough Days • Health Insurance Rate Increase
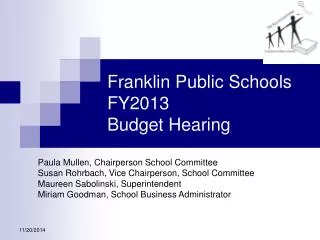
Revenue Sources for the Budget FY2013-2014 The two major funding sources for the general operating budget are the City of Richmond and the Virginia Department of Education. • Local appropriation • City of Richmond • State support • SOQ Programs • Sales Tax • Lottery Funded Programs • Other • Tuition & fees • Federal support • Impact Aid • Air Force • Army Reserve *Excludes federally restricted funds such as Title I & IDEA
Net Revenue Changes • FY2013-2014 NET REVENUE CHANGES BY CATEGORY One-Time Funding: - $ 6,829,300 Net State Revenue Gain: 4,148,658 Net Other Revenue Loss: -822,400 Net Federal Revenue Gain: 55,500 Net Revenue Change - $ 3,447,542
Expenditures for the Budget FY2013-2014 The pie chart shown below represents functional spending for the general operating budget as defined by the Virginia Department of Education. What it pays for: • Instruction • Admin, Attendance & Health • Pupil Transportation • Operations, Maintenance & Facilities • Fund Transfers What it does not pay for: • Construction/Capital Projects • School Nutrition Services • State Operated Programs • Federal Programs (Title I, IDEA) • Other Pass-Through Programs (Maggie Walker, MSiC) *Data based on VDOE Chart of Accounts; not based on Standards of Quality (SOQ) Funding Methodology
Net Expenditure Changes FY2013-2014
Projected Budget Summary FY2013-14 • Revenue Decreases $ 3,447,542 • Expenditure Increases $ 8,165,200 • FY2014 Funding Gap $11,612,742
Proposed Budget Changes FY2013-14
Proposed Budget Changes FY2013-14