Download
1 / 50

E N D
WEEK 3 Shadow of a Mountain & Weather
01 Shadow of a Mountain
PHENOMENA How do you think a man-made mountain will help fight drought conditions in the UAE? Click here to read more United Arab Emirates https://www.washingtonpost.com/news/worldviews/wp/2016/05/02/the-uae-may-build-a-mountain-to-make-it-rain/
Outcome Essential Question I Can: Describe and locate areas where weather and climate are altered by Earth’s features. How could half a state in the United States be green and lush and the other half brown and dry?
STEMScopes Streaming Learn about how geological changes created the Amazon River to the east and the Atacama Desert to the west and about the diverse wildlife in South America. The Andes and South American Ecosystems https://app.acceleratelearning.com/media_assets/360
Video Questions & Answers 1. Q: Explain how the formation of the Andes Mountains caused large changes in South America. A: Example: As the mountains formed and rose higher, they changed the direction that the rivers in South America flowed, creating entirely new ecosystems. 2. Q: How would you describe the Amazon rain forest? A: Example: It is a vast forest full of many different types of plants and animals in large quantities. 3. Q: Describe how the western front of the Andes Mountains differs from the eastern side. A: Answers will vary. Example: Instead of a vast rain forest full of life, the Atacama Desert is very dry and barren.
4. Q: How is the llama's origin tied to the geological changes happening in South America? A: Example: Even though llamas are perfect for Andean life, they did not appear in South America until 3 million years ago. Their ancestors were actually in North America 40 million years ago. The fact that these land animals made it to South America 3 million years ago shows that North and South America were connected with a land bridge around that time. 5. Q: Why do you think more North American animals migrated south over the land bridge than the other way around? (Answers will vary. A: Example: The climate and food resources were better toward the south than the north. 6. Define biodiversity. A: Example: The diversity of plants and animals in an ecosystem. 7. Q: Explain how the diversity in South America has grown from just biodiversity. A: Example: The older, rural life of South American people has grown into a modern era with connections to North America and Europe. The people there have grown internationally.
What is weather? Tracking Weather 02 Weather
PHENOMENA Panama City, Florida What do spaghetti models show us? Click here to read more https://weather.com/science/weather-explainers/news/spaghetti-models-tropics-tropical-storm-hurricane
Spaghetti Models • Spaghetti weather models, also known as spaghetti plots, are a simplistic way of conveying a lot of tropical information quickly, but there can also be downfalls to relying on these plots. • Spaghetti models show where a tropical system may go. • When clustered together, forecast confidence is high. • But spaghetti plots do not show where impacts will occur. • https://www.youtube.com/watch?v=BtW_x9VfCq0
Spaghetti Plots Do Not Portray Any Impacts • Although most models show possible impacts, to present many models succinctly on a single chart, meteorologists generally produce spaghetti plots that usually only show the “where” and a loose representation of “when” for tropical systems. • To get to this level of brevity, meteorologists must only focus on the center point of a tropical system, which may or may not be accurate. We’ll get to more on that limitation later, but for now, let’s focus on the lack of impacts. • These plots do not speak to whether a storm will bring rainfall, hurricane-force winds, surge, or other data; they just contain information about the center of a storm's future track.
Each Model Has a Slightly Different Purpose • Some weather models are built on statistics, some on atmospheric dynamics, others are built on other models and others yet are built entirely on climatology and persistence of the current atmosphere. • Two of these models, called the CLP5 (the CLImatology and PERsistence model) and the XTRP (Extrapolated), seem to always get found on model plots, but neither contains any useful information about the forecast. • The CLP5 uses past weather situations, or analogs, to diagnose what similar storms have done in the past. A "bad model" is one that does worse than the CLP5. The XTRP simply extends the storm’s recent motion out to five days and is always a straight line. This batch of models is often called the pure statistical models.
Some models just follow the winds, and they are collectively called the TABs (or Trajectory and Beta models). • These three models — shallow, medium and deep — are slightly more useful because the closer they are together, they indicate that there is less wind shear in the atmosphere. On the contrary, if they are spread out, this is indicative that there's more wind shear and the system will likely stay weak. A weak system should not be monitored using the deep version of the TABs — called the TABD — since those systems do not usually tap the upper portions of the atmosphere. • The statistical-dynamical weather models are a little more complex. These models combine statistics such as storm location, time of year and what hurricanes of the past have done with simple dynamics such as steering flow. This suite includes the SHIPS and LGEM models, which are largely intensity models. • The most complex are the dynamical weather models, which take into account the current state of the atmosphere using observations from the ground, ocean and air, as well as complex physics equations, to forecast the atmosphere. This suite of models includes the American Global Forecast System (GFS), and the hurricane models (HWRF and HMON), among many others.
Forecast Models Are Limited By Human Imagination and Bounded By Weather Data • In many cases, an educated imagination comes into play when picking a starting point for these spaghetti models. These cases include the formative stages of tropical cyclones that incorporate invests, tropical depressions and tropical storms, where picking out the center of circulation — the point where models must latch onto — can be difficult. • This image shows the model track forecasts for July 2016's Invest 97L. Half of the problem here is that we included both "early" and "late" models in the graphic. By early and late, we are talking about how early or late models run respective to when the National Hurricane Center produces their official updates. • The other half of the problem is that even within one batch of models (i.e. early vs. late or a single model run many times, called ensembles), the origin points are not always the same. Look at the big variation in where the green models (AP## or GEFS) begin. In a case where this is close to land, that can mean the difference between having a tropical system over land or in the water, which can have drastic repercussions as little as 12 hours into the future.
Another case where forecasts may not be as good is over the open ocean, since the amount of land-based and even ocean-based observations drop. • The model is usually most accurate at the point of origin, and model accuracy decreases over time. Without this point being accurate, the repercussions end up being a rather inaccurate model. • Over the years, the amount of data going into our models has continued to grow in order to make them more accurate. Of course, bad data, such as a bad point of origin, depletes this accuracy.
Looking at Ensembles May Be the Way to Go, Especially Days in Advance • There is also a second flavor of models that can be especially helpful 3-7 days in advance called an "ensemble." • This suite can be full of more than 50 weather models with varying levels of correctness and experience. • The most well-known models – the Euro, GFS, Canadian, and others – all have ensembles. An ensemble is a collection of forecasts all valid at the same forecast time. • For instance, the GFS is run 21 times with slightly varying initial conditions and physics to get the Global Ensemble Forecast System (GEFS). The GEFS's members are expected to vary somewhat due to their differences in how they are started and run. • Each one should be roughly the same, but each one will actually be ever so slightly different based on the instrument itself and the experience of the user.
Ensembles should be leaned on in the medium to long-term forecast realm to see all of the possibilities for a given period. • Ensemble systems can be helpful in multiple ways. • Firstly, if these ensembles are tightly packed close together in 3 to 7 days, the confidence in a forecast is higher, but it still should be checked against other ensembles like the European or Canadian. Remember that each ensemble member is still buying into the main member's ideas, and it will go roughly where that main member goes. • Secondly, if a model's ensemble is tightly packed but still diverges from other models like the Euro or the hurricane models, it could be either very arrogant or likely to be correct. Figuring out which of these possibilities is correct comes with forecaster experience. • Finally, if this ensemble's members are spread apart within two to four days, you know that model has less confidence or that the overall forecast is a highly uncertain forecast. https://www.youtube.com/watch?v=_rRh_0n43B8
Outcomes Essential Questions I Can: Distinguish between climate and weather and explain how one impacts the other. I Can: Analyze weather data and draw conclusions about weather instruments that are used to collect that data. How is weather different from climate? What tools do meteorologists use to predict the weather?
STEMScopes Meteorologist Influences of Weather & Climate Career Connections https://app.acceleratelearning.com/scopes/13735/elements/611530
WHICH IS IT? Statement 1: Tells us what kind of clothes to wear Statement 2: Tells us what kind of clothes to buy Weather Climate Directions: Sort the cards into two categories: weather and climate. Be prepared to defend your answers with the class Statement 3: Average conditions over several years Statement 4: Can change dramatically from year to year Statement 5: Your idea about what it’ll be like when you visit a place
Predicting Weather Explain: STEMscopedia Predicting Weather STEMScopes https://app.acceleratelearning.com/scopes/13725/elements/660722
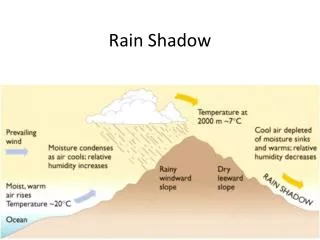
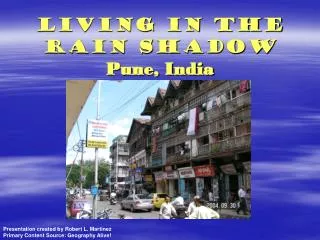
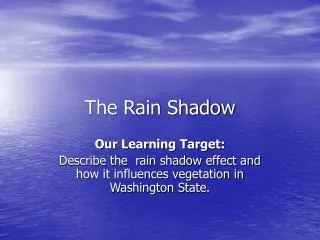
Rain Shadow A rain shadow is a region having little rainfall because it is sheltered from prevailing rain-bearing winds by a range of hills or mountains. An example is a patch of land that has been forced to become a desert because mountain ranges blocked all plant-growing, rainy weather. On one side of the mountain, wet weather systems drop rain and snow. On the other side of the mountain—the rain shadow side—all that precipitation is blocked. In a rain shadow, it’s warm and dry. On the other side of the mountain, it’s wet and cool. There is a difference because when an air mass moves from a low elevation to a high elevation, it expands and cools. This cool air cannot hold moisture as well as warm air. Cool air forms clouds, which drop rain and snow, as it rises up a mountain. After the air mass crosses over the peak of the mountain and starts down the other side, the air warms up and the clouds dissipate. That means there is less rainfall. Death Valley, a desert in California and Nevada, is so hot and dry because it is in the rain shadow of the Sierra Nevada mountain range. The Sierra Nevada block wind and weather systems from reaching Death Valley. The Tibetan Plateau, a rain shadow in Tibet, China, and India has the Himalaya mountain range to thank for its dry climate.
A rain shadow area is dry because, as moist air masses rise to top a mountain range or large mountain, the air cools and the maximum moisture content decreases until it reaches the dew point, where the water vapor condenses as rain or snow and falls on the windward side or top of the mountain.This process is called orographic precipitation.
STEMScopes Predicting Weather: Explore 4: Activity— The Effect of Landforms on Weather. Amount of yearly rainfall Salem: 45 inches Pendleton: 14 inches Eugene: 47 inches Redmond: 8-10 inches Medford: 18.35 inches Lakeview: 14 inches https://www.youtube.com/watch?v=iMu4dShS74w
Psychrometer Anemometer An instrument for indicating the velocity or pressure of the wind; a wind-gage. Thermometer Rain Gauge An instrument that uses the difference in readings between two thermometers, one having a wet bulb and the other having a dry bulb, to measure the moisture content or relative humidity of air. A device, used in meteorology, to measure rainfall aka a pluviometer. An instrument for measuring temperature, especially one having a graduated glass tube with a bulb containing a liquid, typically mercury or colored alcohol, that expands and rises in the tube as the temperature increases. WEATHER INSTRUMENTS STATIONS This was for a lab
PSYCHROMETER ABOUT HOW TO USE VOCABULARY A psychrometer is an instrument used for measuring the humidity (water vapor) in the atmosphere. Humidity measurement instruments usually rely on measurements of some other quality such as temperature, pressure, mass or a mechanical or electrical change in a substance as moisture is absorbed. By calibration and calculation, these measured quantities can lead to a measurement of humidity. Modern electronic devices use temperature of condensation or electrical changes to measure humidity differences. The bulb of one thermometer is kept wet (by means of a thin, wet cloth wick) so that the cooling that results from evaporation makes it register a lower temperature than the dry-bulb thermometer. When readings are taken simultaneously, it is possible (with the use of psychrometric tables) to determine the relative humidity and dew-point temperature of the air. A decrease in the humidity of the air brings an increase in the difference between dry- and wet-bulb temperatures, called the wet-bulb depression. Relative humidity tells us how much water vapor is in the air, compared to how much it could hold at that temperature. It is shown as a percent. For example, a relative humidity of 50 percent means the air is holding one half of the water vapor it can hold. Again, this is all dependent on the temperature. Dew point, the temperature at which the atmosphere is saturated with water vapor, when it is cooled without changing its pressure or vapor content. A given volume of air containing much water vapor has a higher dew point than the same volume of drier air; thus the dew point gives an indication of the humidity.
THERMOMETER Hold the thermometer horizontally so you can read the numbers. Bring it up to eye level with the end of the liquid right in front of you. Look for the long lines, which indicate 1 °F (−17 °C) each and the smaller lines, which indicate 0.2 °F (−17.7 °C) each. Read the nearest number to the end of the liquid, counting the small lines if you need to. ABOUT HOW TO USE VOCABULARY Temperature is measured by an instrument called a thermometer. Most common for measuring air temperature is the liquid-in-glass thermometer, which consists of a glass tube enlarged at the bottom into a bulb that is partially filled with colored alcohol mixture. The tube’s hollow core is extremely small—less than 0.02 inch (0.5 millimeter) in diameter. Thus, a small amount of expansion or contraction of the alcohol mixture in the bulb, caused by heating or cooling, produces a noticeable rise or fall in its level in the tube. The tube’s thick, curved face acts as a magnifier that makes the thin thread of alcohol mixture clearly visible. In making a liquid thermometer, the colored alcohol mixture is ordinarily driven to the top of the tube by heating. The glass is then sealed off, resulting in a vacuum when the liquid contracts during cooling. For high-temperature applications the tube is filled with a pressurized gas before sealing to prevent the liquid mixture from boiling. Temperature is a measure of how hot or cold something is; specifically, a measure of the average kinetic energy of the particles in an object, which is a type of energy associated with motion.
THERMOMETER STATIONS
ANEMOMETER ABOUT HOW TO USE VOCABULARY An anemometer is a weather tool that is used to measure the wind's speed. It is commonly used in weather stations. The word anemometer is derived from the word 'anemos' - a Greek word that means 'wind'. Any tool used to measure the speed of wind in the science of meteorology is referred to as an anemometer. The most common type of anemometer has three or four cups attached to horizontal arms. The arms are attached to a vertical rod. As the wind blows, the cups rotate, making the rod spin. The stronger the wind blows, the faster the rod spins. The anemometer counts the number of rotations, or turns, which is used to calculate wind speed. Because wind speeds are not consistent—there are gusts and lulls—wind speed is usually averaged over a short period of time. Wind is the movement of air relative to the surface of the Earth. Winds play a significant role in determining and controlling climate and weather. Next
RAIN GAUGE ABOUT HOW TO USE VOCABULARY A rain gauge is an instrument you can use to measure the amount of rainfall your area receives in a given time period. With this, you won’t have to rely on local weather reports. You will have your own data you can use for the good of your plants. A rain gauge is a simple instrument anyone can install and use. Basically it looks like a transparent cylinder with markings. You can read the amount of rainfall in inches or millimeters. Rain is liquid precipitation: water falling from the sky. Raindrops fall to Earth when clouds become saturated, or filled, with water droplets. Millions of water droplets bump into each other as they gather in a cloud. When a small water droplet bumps into a bigger one, it condenses, or combines, with the larger one. When the water droplet becomes too heavy to continue floating around in the cloud, it falls to the ground.
STATIONS Weather Instruments Notes