Download
1 / 21
210 likes | 307 Views
“Link-level Measurements from an 802.11b Mesh Network”. Daniel Aguayo (MIT), John Bicket (MIT), Sanjit Biswas (MIT), Glenn Judd (CMU), Robert Morris (MIT). Summary presented by Gary Woo. Outline. Assumptions in “neighbor” abstraction What is Roofnet? Experiment/Results Hypotheses Cause

E N D
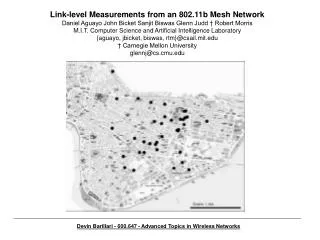
“Link-level Measurements from an 802.11b Mesh Network” Daniel Aguayo (MIT), John Bicket (MIT), Sanjit Biswas (MIT), Glenn Judd (CMU), Robert Morris (MIT) Summary presented by Gary Woo CS 577
Outline • Assumptions in “neighbor” abstraction • What is Roofnet? • Experiment/Results • Hypotheses • Cause • Conclusion • Additional experiments CS 577
“Neighbor” abstraction • Nodes are divided into pairs that can communicate and pairs that can not • Examples of usage: • Wired networks • Obvious physical connection • MAC protocol in 802.11 • Supported based on S/N and BER relationship CS 577
Roofnet • Located in Cambridge, MA next to MIT • 38 nodes with roof top antennas CS 577
Experiment setup • Use 802.11b cards with Prism 2.5 chip set • Set to channel 3 (2.422Ghz) • Pseudo-IBSS (ad hoc) mode • Run early Sunday morning June 6th, 2004 • 1500 byte 802.11 broadcast for 90 seconds • Sequence Number, Arrival Time, Receive Signal Strength Indication (RSSI), Silence values are saved CS 577
Results • Results show that nodes don’t adhere to “neighbor” abstraction Red = expected CS 577
Delivery probability Delivery probability Sample (each point is 200 milliseconds) Sample (each point is 200 milliseconds) 11 Mbit/s links 1 Mbit/s links Delivery probability burstyness • Average loss rate are all about 50% CS 577
Loss due to long interference? • Allan Deviation of loss rate measures fluctuations (high means very bursty, low means more smooth) Yellow box shows that around 80% of all pairs have low Allan Deviation of loss rate (around 0.06) CS 577
Loss due to distance? • Yellow circles are the same size (approximately centered around Sender) • There is relation of distance/receiving signal, however not consistent CS 577
Broadcast packet delivery probability Laboratory Roofnet Signal-to-noise ratio (dB) Loss due to noise? • High signal and low noise should result in delivery • Roofnet doesn’t show strong correlation Result for1 Mbit/s High signal packets still lost CS 577
Experiment packets lost per second Non-Roofnet packets observed per second (before the experiment) Loss due to 802.11 interference? • If cause is this interference, then the more interference packets the more packets would be drop Few interference packets before experiment CS 577
So what is the cause? • “when you have eliminated the impossible, whatever remains, however improbable, must be the truth” – Sherlock Holmes in The Adventure of the Beryl Coronet (1892) CS 577
Reflected signals • Buildings and other physical objects reflects signals • Weaker duplicated signal are received by nodes after a delay • RAKE receiver can suppress reflected copies with delays up to 250 nanoseconds CS 577
Receiver Sender delay attenuation Experiment for reflected signals • Signal sent to the receiver, and combined with a duplicated version of the original signal (with added delay, and reduce strength) CS 577
Results for reflected signals experiment • Yellow shows RAKE working • Green shows loss if reflected signal is almost as powerful as original the receiver is confused • Blue shows intersection with the modulation’s symbol boundaries CS 577
Cumulative fraction of links Link distance (feet or nanoseconds) Distance between links • Most links have greater than 500 nanosecond delays, RAKE can’t handle CS 577
Conclusion • No clear distinction of links that drop a lot of packets verses ones that receive most • Link distance and Signal to Noise ratio has relation but not strong • Most likely cause is multi-path fading (reflected signals) CS 577
Varying signal strength • The stronger the signal, the higher the probability of being delivered 1 Mbit/s CS 577
Throughput compared based on bit rate Shaded portion shows that X Mbit/s can successfully send more packets than other rates • Algorithm should wait until delivering half the packets before reducing bit rate CS 577
References and Acknowledgements • Author's slides for SIGCOMM 2004 (figures in color were taken from these slides): • http://www.pdos.lcs.mit.edu/roofnet/sigcomm-talk.ppt • Author’s electronic version of paper (other figures and tables were taken from this document): • http://www.pdos.lcs.mit.edu/~rtm/papers/p442-aguayo.pdf • Roofnet’s group website: • http://www.pdos.lcs.mit.edu/roofnet/index.php CS 577