Download
1 / 33
500 likes | 1.57k Views
In the Name of the Most High . Remote Monitoring (RMON). by Behzad Akbari Fall 2008. RMON. • Remote Network Monitoring (RMON): monitoring the state of a network and its nodes through a remote probe. • Why? – Significantly reduces SNMP traffic due to local polling.

E N D
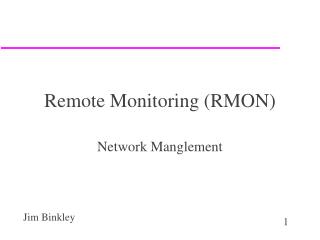
In the Name of the Most High Remote Monitoring (RMON) by Behzad Akbari Fall 2008
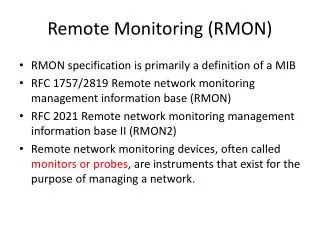
RMON • Remote Network Monitoring (RMON): monitoring the state of a network and its nodes through a remote probe. • Why? – Significantly reduces SNMP traffic due to local polling. – No need for agent to be visible to managers all the time. • Reduces Ping messages. – Continuous monitoring of individual segments – Has been shown to increase productivity for network administrators. • components: – Data gatherer: a physical device – Data analyzer: processor that analyzes data • RMON does both and reports to a manager
RMON in the Network • All 4 probes in this example are RMON probes. Figure 8.1 Network Configuration with RMONs
RMON MIB • Ethernet RMON: (rmon 1 - 9) • Token ring extension: (rmon 10) • RMON 2: Higher layers (rmon 3 – 7 and rmon 11 - 20) RFC 1757 (2819) Layer: 2 (Ethernet) RFC 2021 Layers: 3-7 RFC 1513
Textual Convention: Row Creation & Deletion • EntryStatus data type introduced in RMON • EntryStatus (similar to RowStatus in SNMPv2) used to create and delete conceptual row. • Only 4 states in RMON compared to 6 in SNMPv2
RMON Groups and Functions RMON Probe
RMON1 MIB Groups & Tables • Ten groups divided into three categories • Statistics groups (rmon 1, 2, 4, 5, 6, and 10)) • Event reporting groups (rmon 3 and 9) • Filter and packet capture groups(romon 7 and 8) • Groups with “2” in the name are enhancements with RMON2
Control and Data Tables • • Control table used to set the instances of data rows in the data table. • Can be set to gather and store different instances of data. • • Values of data index and control index are the same. Figure 8.4 Relationship between Control and Data Tables
Control Table Values • controlIndex – Integer uniquely identifying the row in the control table. • controlDataSource – identifies the source of the data being collected. • controlTableSize – identifies the entries associated with the data source. • controlOwner – entity or person that created the entry. – Can be a management station name, phone number, contact info • controlStatus – entry status of textual conversion (valid, createRequest, underCreation, invalid). • controlOther – Could be another object
Example: Matrix Control and SD Tables Figure 8.4 Relationship between Control and Data Tables
The Statistics Group • The simplest of the RMON groups. • Counters to store number of packets. • The etherStatsTable in this group has an entry for each interface. • Counts packets with characteristics defined by objects in the etherStatsTable. • There are 21 columns in the table, such as: – etherStatsOversizePackets - >1518 octets – etherStatsUndersizePackets - < 64 octets – etherStatsCRCAlignErrors – etherStatsCollision – etherStatsPkts65to127Octests – etherStatsPkts128to255Octests – etherStatsPkts256to511Octests – … • Good example of monitoring!
etherStatsTable etherStatsEntry etherStatsIndex etherStatsDataSource etherStatsDropEvents etherStatsOctets etherStatsPkts etherStatsBroadcastPkts etherStatsMulticastPkts etherStatsCRCAlignErrors etherStatsUndersizePkts etherStatsOversizePkts etherStatsFragments etherStatsJabbers etherStatsCollisions etherStatsPkts64Octets etherStatsPkts65to127Octets etherStatsPkts128to255Octets etherStatsPkts256to511Octets etherStatsPkts512to1023Octets etherStatsPkts1024to1518Octets etherStatsOwner etherStatsStatus statistics ifIndex.1. rmon 1
History Group • Enables the network manager to build a record of what is happening in the network over time. • Two tables: • historyControltable (7 columns) allows for the settings: – Data source historyControlDataSource – sampling intervals historyControlInterval – Number of sampling intervals historyContolBuckets • etherHistoryTable (15 columns) allows for Ethernetspecificsettings – how many Ethernet packets were sampled in the interval time.
historyControlTable historyControlEntry historyControlIndex historyControlDataSource historyControlBucketsRequested historyControlBucketsGranted historyControlInterval historyControlOwner historyControlStatus history etherHistoryTable etherHistoryEntry etherHistoryIndex etherHistorySampleIndex etherHistoryIntervalStart etherHistoryDropEvents etherHistoryOctets etherHistoryPkts etherHistoryBroadcastPkts etherHistoryMulticastPkts etherHistoryCRCAlignErrors etherHistoryUndersizePkts etherHistoryOversizePkts etherHistoryFragments etherHistoryJabbers etherHistoryCollisions etherHistoryUtilization rmon 2
historyControlTable historyControlEntry historyControlIndex historyControlDataSource historyControlBucketsRequested historyControlBucketsGranted historyControlInterval historyControlOwner historyControlStatus
Host Group • Identifies traffic statistics with the host that is detected on the subnet. –This group makes a connection between the host and the traffic. – We can ask a question like “Why is host A transmitting more packets than host B?” • Three tables: • hostControlTable (6 columns), records the number of hosts that have transmitted or received frames in the subnet. • hostTable (10 columns), the actual data – For each interface specified in hostControlTable, hostTable contains one row for each MAC address on that interface. – instance identifier for the hostAddress object: 1.6.0.0.163.224.24.130 • hostTimeTable (10 columns) information stored based on time, not MAC – Has the exact same information as hostTable, except it is index by creation order, not MAC address
hostControlTable hostControlEntry hostControlIndex hostControlDataSource hostControlTableSize hostControlLastDeleteTime hostControlOwner hostControlStatus hosts rmon 4 hostTimeTable hostTimeEntry hostTimeAddress hostTimeCreationOrder hostTimeIndex hostTimeInPkts hostTimeOutPkts hostTimeInOctets hostTimeOutOctets hostTimeOutErrors hostTimeOutBroadcastPkts hostTimeOutMulticastPkts hostTable hostEntry hostAddress hostCreationOrder hostIndex hostInPkts hostOutPkts hostInOctets hostOutOctets hostOutErrors hostOutBroadcastPkts hostOutMulticastPkts
hostTopN rmon 5 • hostTopNTable • hostTopNEntry • hostTopNReport • hostTopNIndex • hostTopNAddress • hostTopNRate hostTopNControlTable hostTopNControlEntry hostTopNControlIndex hostTopNHostIndex hostTopNRateBase hostTopNTimeRemaining hostTopNDuration hostTopNRequestedSize hostTopNGrantedSize hostTopNStartTime hostTopNOwner hostTopNStatus * hostTopNInPkts(1), hostTopNOutPkts(2), hostTopNInOctets(3), hostTopNOutOctets(4), hostTopNOutErrors(5), hostTopNOutBroadcastPkts(6), hostTopNOutMulticastPkts(7)
Matrix Group • This allows us to determine the source and destination of a communication. • Adds another dimension to network management in that we will know which communications are causing the most traffic, not just which hosts. • This is done using 3 tables: – matrixControlTable – matrixSDTable • Indexed by matricSDIndex, then by source address, then by destination address – matricDSTable • Indexed by matricDSIndex, then by destination address, then by source address
matrix • matrixControlTable • matrixControlEntry • matrixControlIndex • matrixControlDataSource • matrixControlTableSize • matrixControlLastDeleteTime • matrixControlOwner • matrixControlStatus rmon 6 • matrixSDTable • matrixSDEntry • matrixSDSourceAddress • matrixSDDestAddress • matrixSDIndex • matrixSDPkts • matrixSDOctets • matrixSDErrors • matrixDSTable • matrixDSEntry • matrixDSSourceAddress • matrixDSDestAddress • matrixDSIndex • matrixDSPkts • matrixDSOctets • matrixDSErrors
Filter Group rmon 7 • Filter group used to capture packets defined by logical expressions • Channel is a stream of data captured based on a logical expression • Filter table allows packets to be filtered with an arbitrary filter expression • A row in the channel table associated with multiple rows in the filter table
filter • channelTable • channelEntry • channelIndex • channelIfIndex • channelAcceptType • channelDataControl • channelTurnOnEventIndex • channelTurnOffEventIndex • channelEventIndex • channelEventStatus • channelMatches • channelDescription • channelOwner • channelStatus • filterTable • filterEntry • filterIndex • filterChannelIndex • filterPktDataOffset • filterPktData • filterPktDataMask • filterPktDataNotMask • filterPktStatus • filterPktStatusMask • filterPktStatusNotMask • filterOwner • filterStatus On(1) Off(2) eventReady(1), eventFired(2), eventAlwaysReady(3) acceptMatched(1), acceptFailed(2)
Packet Capture Group • Packet capture group is a post-filter group • Buffer control table used to select channels • Captured data stored in the capture buffer table
RMON2 • RMON1 dealt primarily with the OSI data link layer. • RMON2 is applicable to layers 3 and above: network to application layer. – Good for determining bandwidth use by applications. • Functions are similar to RMON1. • Nine more groups are added to RMON1. • Enhancement to RMON1 • Defined conformance and compliance.
RMON2 MIB Table 8.4 RMON2 MIB Groups and Tables
A Case Study • A study at Georgia Tech on Internet traffic • Objectives – Traffic growth and trend – Traffic patterns • Network comprising Ethernet and FDDI LANs • Tools used – HP Netmetrix protocol analyzer – Special high-speed TCP dump tool for FDDI LAN • RMON groups utilized – Host top-n – Matrix group – Filter group – Packet capture group (for application level protocols)
Case Study Results Traffic Pattern