Download
1 / 2
20 likes | 112 Views
Impact of ocean acidification on pelagic calcification. (Gehlen and Schneider, CARBOOCEAN 511176 (GOCE), deliverable 16.4, unpublished results).

E N D
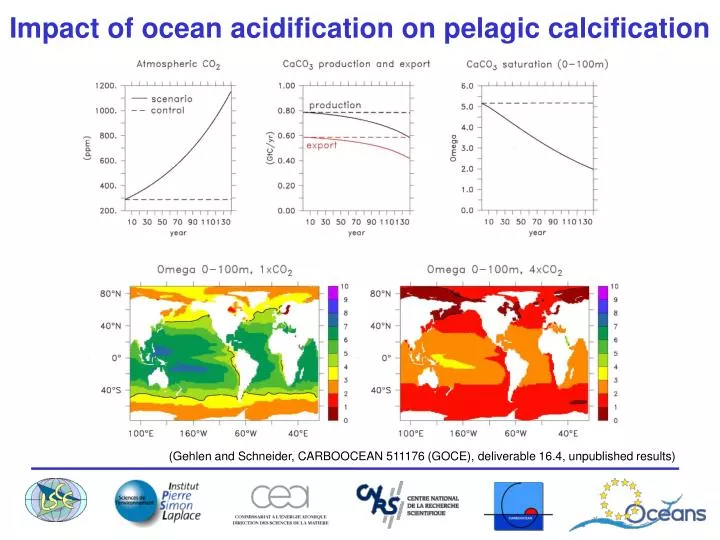
Impact of ocean acidification on pelagic calcification (Gehlen and Schneider, CARBOOCEAN 511176 (GOCE), deliverable 16.4, unpublished results)
The slide shows results of a model simulation (PISCES/NEMO) where marine pelagic calcification is dependent on the saturation state (Ω) of seawater with respect to the CaCO3 polymorph calcite. With increasing CO2 uptake by the ocean (acidification) the saturation state decreases. When Ω is larger than 1 the water is supersaturated, and for Ω between 0 and 1 the water is undersaturated, the latter being a prerequisite for pelagic CaCO3 dissolution. • Upper left: • Atmospheric CO2 concentrations are prescribed to increase from preindustrial values of 286 ppm (1xCO2) to four times the preindustrial value (1153 ppm, 4xCO2). This is realized by a 1% increase each year over a time period of 140 years. The full black line shows the prescribed atmospheric CO2 concentration in the scenario run, the dashed line is the control experiment, where CO2 is kept constant on the preindustrial value. • Upper middle: • Global annual integrals of pelagic calcite production (black) and export flux (red) in gigatons carbon per year. Export is the amount of CaCO3 that falls through the 100m depth level. Both rates are decreasing by about 25 %. • Upper right: • Mean value for the saturation state of seawater with respect to calcite (Ω) for the top 0-100m of the water column. Ω is rapidly decreasing from about 5 to 2. • Bottom: • Map of Ω for the top 0-100m of the water column at 1xCO2 (left) and 4xCO2 (right). • Left: green (and blue) areas mark those areas where Ω>4 (see also contour line), which is an important threshold value for calcification of coral reefs (not taken into account in this study) • Right: Ω is lower than 4 everywhere and in some high latitude areas even undersaturation Ω<1 (see contour line) occurs.