Download
1 / 7
70 likes | 239 Views
Supplementary Figure S1 - NMF cluster analyses. Thompson series. Cho series. Kool – Fattet – McCabe series. Northcott series. Remke series. Figure S2a: Subgroup distributions GEP and TMA cohorts. All patients TMA. All patients GEP + TMA. All patients GEP. All infants TMA.

E N D
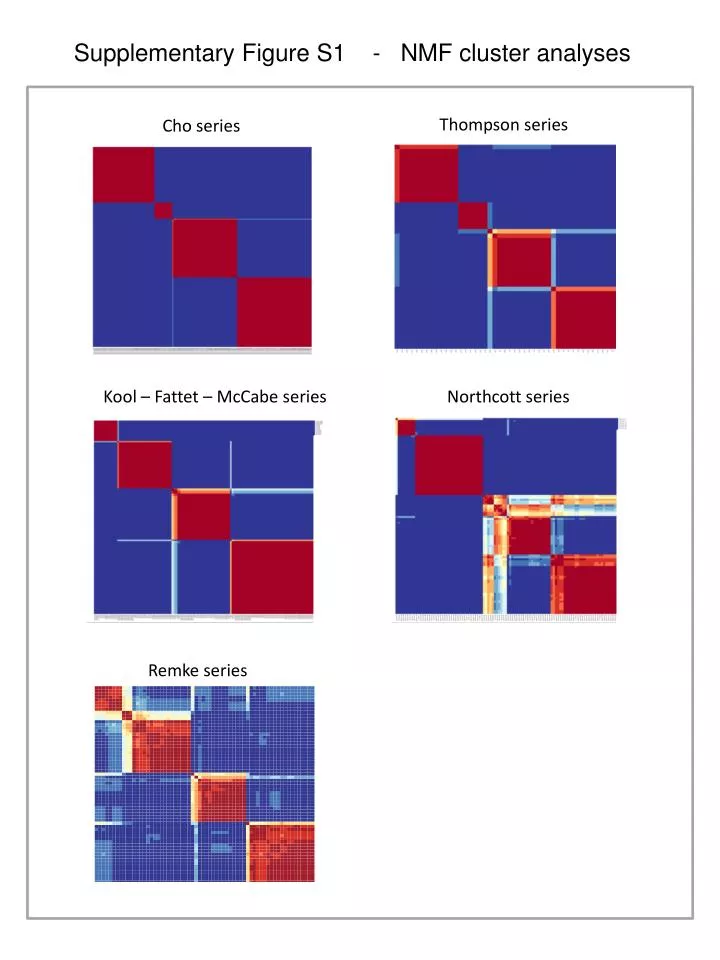
Supplementary Figure S1 - NMF cluster analyses Thompson series Cho series Kool – Fattet – McCabe series Northcott series Remke series
Figure S2a: Subgroup distributions GEP and TMA cohorts All patients TMA All patients GEP + TMA All patients GEP All infants TMA All infants GEP + TMA All infants GEP All children TMA All children GEP + TMA All children GEP All adults TMA All adults GEP + TMA All adults GEP WNT SHH GRP3 GRP4
Figure S2b: Subgroup distributions GEP and TMA cohorts All patients TMA All patients GEP + TMA All patients GEP All infants GEP All infants TMA All infants GEP + TMA All children GEP All children TMA All children GEP + TMA All adults TMA All adults GEP + TMA All adults GEP
Figure S2c: Male : female distributions GEP and TMA cohorts All patients TMA All patients GEP + TMA All patients GEP All infants GEP All infants TMA All infants GEP + TMA All children GEP All children TMA All children GEP + TMA All adults TMA All adults GEP + TMA All adults GEP
Figure S2d: Histology distributions GEP and TMA cohorts All patients TMA All patients GEP + TMA All patients GEP All infants GEP All infants TMA All infants GEP + TMA All children GEP All children TMA All children GEP + TMA All adults TMA All adults GEP + TMA All adults GEP
Figure S2e: Metastasis frequencies GEP and TMA cohorts All patients TMA All patients GEP + TMA All patients GEP All infants GEP All infants TMA All infants GEP + TMA All children GEP All children TMA All children GEP + TMA All adults TMA All adults GEP + TMA All adults GEP
Figure S3: Survival analyses subgroups TMA All patients Infants Children Adults WNT WNT SHH SHH SHH SHH GROUP 4 GROUP 4 WNT GROUP 3 GROUP 3 GROUP 4 GROUP 3 a b c d P < 0.001 P < 0.001 P < 0.001 P < 0.001 M0 M0 M0 M0 M+ M+ M+ M+ e f g h P = 0.001 NS P < 0.001 P = 0.046 DESMOPLASTIC DESMOPLASTIC DESMOPLASTIC DESMOPLASTIC CLASSIC CLASSIC CLASSIC CLASSIC LCA LCA LCA LCA i j k l P < 0.001 P = 0.001 P < 0.001 P = 0.004 WNT SHH GROUP 3 GROUP 4 M+ M0 M0 M0 M+ M+ M0 M+ m n o p NS NS P = 0.009 NS DESMOPLASTIC CLASSIC CLASSIC CLASSIC LCA LCA CLASSIC LCA q r s t P = 0.017 P = 0.004 P < 0.001