Download
1 / 25
260 likes | 273 Views
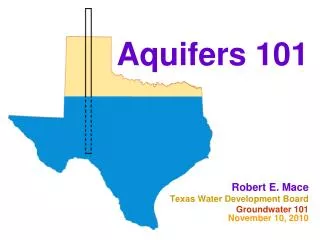
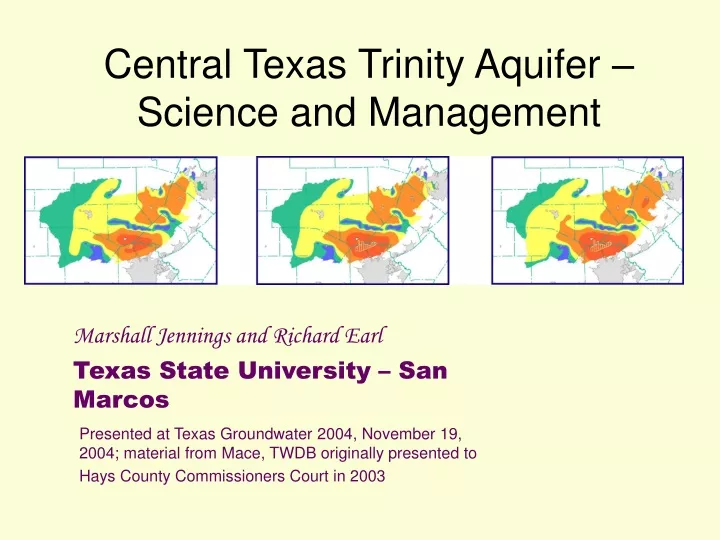
Central Texas Trinity Aquifer –Science and Management. Marshall Jennings and Richard Earl Texas State University – San Marcos. Presented at Texas Groundwater 2004, November 19, 2004; material from Mace, TWDB originally presented to Hays County Commissioners Court in 2003. Purpose of Talk.

E N D
Central Texas Trinity Aquifer –Science and Management Marshall Jennings and Richard Earl Texas State University – San Marcos Presented at Texas Groundwater 2004, November 19, 2004; material from Mace, TWDB originally presented to Hays County Commissioners Court in 2003
Purpose of Talk • To overview aquifer science of the Central Texas Trinity Aquifer that includes 10 counties and 8 GCDs in Central Texas; the material is largely drawn from Mace et al (2000) or the Trinity Aquifer GAM • To discuss aquifer management by GCDs and the Hill Country Alliance of GCDs
Recharge • Previously published values: • Muller and Price (1979) 1.5 % • Ashworth (1983) 4. % • Kuniansky (1989) 11. % • Kuniansky and Holligan (1994) 7. % • Bluntzer (1992) (calc.) 6.7 % • Bluntzer (1992) (est.) 5. % • our analysis 6.6 % • our model 4.0 % • Conclusions: - Percentage likely varies with rainfall amount - For average conditions, 4 to 5 %
Groundwater Management • Ten counties are in the PGMA; however Comal and Travis Counties do not have a local GCD • Eight counties in the Trinity PGMA do have GCDs and by mid-year all of these will have management plans in place • The GCDs have formed an Alliance which meets six times per year and coordinates activities • Individual GCDs vary in their activities and focus
Groundwater Management • All GCDs have a water-level monitoring program and some have QW program • Several recording GW monitors are in operation including one in HTGCD that has GOES telemetry • Data bases are not uniform—all should report to TWDB • Aquifer test information could be better captured in common files
The Trinity Aquifer is modeled with a USGS-developed model called MODFLOW; the same model is used in several other Texas GAMs Essentially all the science information from many years of careful hydrogeology work is entrusted to a “groundwater geek” such as Rob Mace….O boy!!
GAM Simulation • Mace et al (2000) describe a dramatic but realistic simulation for the Trinity GAM • A power point “video” for the 50 year simulation is available • The following slides show 1997 vs 2050 • My well in Hays County is projected to fall 100 – 150 feet by 2050!
Water Budgets Using the GAM • 1975 was a typical year for the Trinity GAM region and a steady-state budget is available • The following results for Hays County are similar for all ten counties but with varying quantities • Wells in Hays County were only 700 AF/yr in 1975 and in the round-off error
Model water budget for the Trinity aquifer in Hays County values in acre-ft/yr
Water Budgets Using the GAM • Large volumes of water are moving through each County each year but only a fraction is available to wells ---- if rivers & springs are to continuing flowing; Hays has about 52,000 AF/yr available. • Groundwater pumpage can come from a fraction of new recharge and from net water moving through Hays County --- perhaps a maximum of 8,000 – 10,000 AF/yr is available
Congratulations to the Texas Water Development Board for successfully completing Phase I of the groundwater availability modeling program!