Download
1 / 36
370 likes | 554 Views
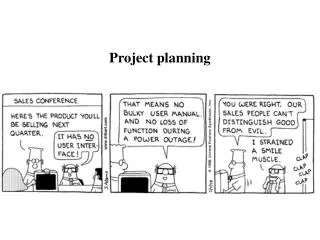
Planning the project. Project Management (lecture). Strategic and tactical levels of planning. Hierarchy of plans. Strategic plans: Focus on the big picture Long term goals (2-5 years) „What?” & „Why?” Tactical plans: Focus on the operations Short term goals (1-18 months) „How?”.

E N D
Planning the project Project Management (lecture)
Strategic and tactical levels of planning Hierarchy of plans • Strategic plans: • Focus on the big picture • Long term goals (2-5 years) • „What?” & „Why?” • Tactical plans: • Focus on the operations • Short term goals (1-18 months) • „How?”
Strategic and tactical levels of planning • Strategy provides a framework for the tactics. Tactical plans should fit the needs of the strategy. • To permit effective tactical decision making strategy should be: • Explicit • Intelligible (easy to understand) • Capable of accepting change • Capable of being monitored • Tactical plans on higher levels act as ‘strategies’ for lower levels in the organisation.
Opportunity cost • That which is sacrificed by choosing or failing to adopt a different course of action to that which is currently planned to be taken; = • the value of the next best alternative foregone (that is not chosen).
The project plan • In its simplest form: „it is an attempt at the timetable for ALL the activities which make up the project”. • As a minimum, it sets out: • ‘how’ • ‘who does what’ • ‘when’ • A more sophisticated plan also states: • ‘what quality’ • ‘what cost and resources’ • Its preparation is an iterative process with continuous reviewing and updating throughout the life of the project (it is never static document but a working tool).
Detailing the plan • Amount of details included should vary in time. • Short term: fully detailed • The short-term horizon is moving forward(the plan become more-and-more detailed).
Who is responsible for the project plan? • The project manager and the project management team • With the advice and assistance of: • the project sponsor • the customer • and other stakeholders
Elements of project planning Iterativeprocess • Project goals (Project SOW): • Project product specifications, costs, quality, deadlines, project deliverables etc. • Project management plan • Work breakdown structure (WBS) • Project network (connections of tasks) • Responsibility assignment • Project schedule (timetable) • Budget (resources & costs) • Risk assessment and risk management
Statement of Work (SOW) SOW forthewhole project:a detailed narrative description of the work required for a project. Can be writtenintheform of a legalcontract, ifwedothe project for an otherorganisation. The effective SOW contains: • Introduction and background • Technical description • Timeline and milestones • Client expectations ThereareSOWsforsubprojects and eventasks, too.
Statement of Work for the tasks within the project • Describes the activities in the tasks in sufficient detail. • Content: • estimated durations • resources required • costs • measures of perfomance (performance indicators) • risks and uncertainties • reporting procedures
Project deliverables (milestones) • a list of things or activities that need to be delivered to meet the defined goals • when and how each item or activity must be delivered • an estimated delivery date for each item or activity
Work Breakdown Structure • Similar to the assembly (Gozinto) charts. • A tool used to define and group a project's discrete work elements (tasks) in a way that helps organize and define the total work scope of the project. • The project is divided into hierarchical groups of tasks (work packages, and work units). • Tasks, work packages and work units should be budgetable (money, labor hours, and other resources). • The technique of creating a WBS is non-uniform.
Example of a WBS Original slide is from the internet
Possible levels in a WBS Project Sub-projects Deliverables Sub-deliverables Workpackages Workunits
Another example of WBS: “Holiday” holiday travel documents booking household passport tickets choose resort confirm cat! brochures insurance Original slide is from the internet
Discussion question • What is the greatest difference between a Gozinto and a WBS chart?
GANTT charts • Named after Henry Gantt (1861 - 1919) an American mathematical engineer. • A Gantt chart is a type of bar chart that illustrates a project schedule. • Gantt charts illustrate the start and finish dates of the work elements (tasks) of a project. • Elements of a GANTT chart: • Task names • Start and finish dates of each tasks (graphically) • Dependency relationships • Task duration in an additional column • Lag relationships (start-to-start, finish-to-start etc.) • Name of the project worker responsible for the task or • Resource specifications • other
Benefits of the GANTT chart • Easy to read and comprehend • Easy to create • Identify the project network coupled with its schedule baseline • Allow for updating and project control • Useful for resource planning
Limitations • Can become quite unwieldy for projects with too many activities. • Projects are often too complex for a Gantt chart. • Gantt charts represent only a part of the project constraints. • The technique of creating a GANTT depends on the features of the project.
activities time 1. 2. 3. 4. 5. 6. GANTT chart example Some Gantt charts also show the dependency relationships between activities.
Activities time 1. 2. 3. 4. 5. 6. GANTT chart example Gantt charts can be used to show current schedule status using percent-complete shadings, or colour lines and a vertical "TODAY" line. today
Readings • Lockyer – Gordon (2005) Chapter 4
Opportunity cost • There are two alternative project. Only one of them can be selected. • Project ‘A’ has an expected net cash flow of 100. • Project ‘B’ has an expected net cash flow of 80. What is the opportunity cost of choosing project ‘A’? What is the opportunity cost of choosing project ‘B’? • There are 3 investment opportunities with given expected net cash flow: ‘A’ = 300; ‘B’ = 250; ‘C’ = 150. Only one investment can be made. Which one should be selected, and what is its opportunity cost? • Someone has 1000 HUF. It can be deposited at a bank (interest is 15%). What is the opportunity cost of not investing?
WBS problem solving 1 • There is a marketing-research project containing a focus group interview and a questionnaire survey with 200 responders. The survey is based on the analysis of the focus group results. • For the focus we have to gather the participants (7 days), organize the event (place, time, equipment etc. – 2 days), implement the interview (1 day), record the interview (2 days), analyse it (3 days) and write a brief research report for the client/sponsor (1 day). • For the survey we have to construct the questionnaire (2 days),test and modify it (1 day), do the sampling (2 day), train the interviewers (1 day), fieldwork (2 days), record the data (1 day), analyse the data (2 days) and write the final study (3 days). • The project manager want to keep a 5 days buffer time for safety at the end of the project.
WBS problem solving 2 Plot a Gozinto and a WBS chart for the next project: • Main task: prepare lunch with 2 dishes. • The 1st course requires 2 main groups of ingredients (A & B) that should be bought separately (time to buy is 30 mins per ingredient-group). Cooking is 1 hr. • The 2nd dish requires 3 group of ingredient (A, C & D), procurement time is the same). Cooking needs 1.5 hrs. • Cleaning after cooking needs 20 mins for 1 person, 10 mins for 2 people.
Gantt exercise • Given the marketing research project plot a Gantt chart with the following information: • Task names • Task durations • Time schedule • Use a backward planning (deadline is the 30th day) and try to reach the shortest total project time (TPT).
GANTT exercise 2 • Given the WBS from the lunch-making-project and the additional information that there are two identical project workers (X and Z) who can work simultaneously, plot a simple GANTT chart with the following content: • Task names • Time schedule (time units are 10 minutes long) • Task durations • Denominate the person in charge for every task • Simultaneous work is possible.
GANTT exercise 2 • How long is the full project? • Denote the precedence relationships in the chart!
GANTT exercise 3 • Show the schedule status on the GANTT chart for the same project after 80 minutes if: • All the A, B and C ingredients are bought, but the purchase of ingredient D is only 67% complete. • The 1st course is already half-cooked, but the „operations” on the 2nd dish could not started yet.
GANTT exercise 4 • Plot a new chart with the same data but with real times within a day. The following information are added: • The market, where the ingredients should be bought is open only from 8 a.m. to 10 a.m. and the earliest is the better. • The lunch preparations (including the cleaning) should be ready exactly at noun (12 a.m.).