Download
1 / 27
270 likes | 273 Views
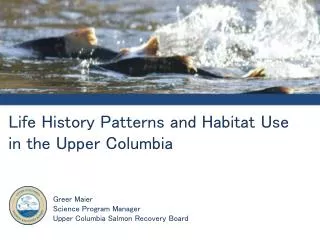
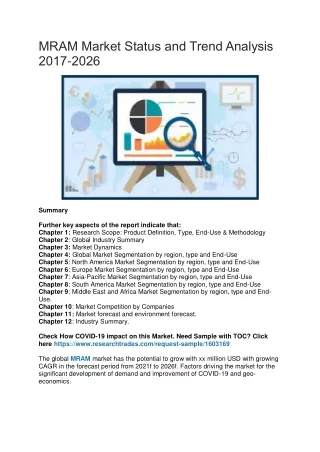
This report analyzes the habitat status and trend in the Upper Columbia ESU, specifically focusing on the Wenatchee and Okanogan basins. It examines various metrics related to habitat quality and identifies potential negative impacts from grazing and road density. The report also discusses the challenges of determining habitat change from background noise and proposes a way to combine multiple habitat variables into a single habitat score. The findings highlight the need for long-term monitoring and evaluation of habitat metrics for effective management.

E N D
Habitat Status and Trend in the Upper Columbia ESU Chapter 3 John Arterburn
Chris Jordan et al.-ISEMP Habitat Status and Trend in the Wenatchee Brent Phillips-Summit Environmental Habitat Status and Trends in the Okanogan from the OBMEP:Temperature Reporting Presentations • Chip McConnaha-ICFI • Habitat Status and Trends in the Okanogan from the OBMEP:EDT3 modeling • Robert Al-Chokhachy-PIBO • PIBO Habitat Status and Trend
Monitoring the Status and Trends of Physical Habitat on Federal Lands Robert Al-Chokhachy, Brett Roper, and Eric Archer
PIBO Findings • Most metrics have large year variance making it difficult to determine habitat change from background noise. • PIBO is attempting to develop a way to combine all 17 habitat variables that they collect into a single habitat score. • Trend data has been used to establish change in managed areas and indicate significant negative impacts from; • Grazing • Road density
Habitat Status and Trends in the Wenatchee and Entiat basins. Chris Jordan, Eric Ward, NOAA-Fisheries; Phil Larsen, PSMFC; Carol Volk, Volk Consulting; Pamela Nelle, Terraqua, Inc.
Management Questions Is habitat changing? Water quality Access Habitat quality Channel condition Riparian condition Stream flow Watershed condition • Placed into the common text: • Is ______ increasing, decreasing, or remaining stable within the distribution of the populations in the Upper Columbia region?
Management Questions that you meant to ask • Is the Wenatchee/Entiat habitat monitoring program generating repeatable, useful metrics? • At what spatial scale are habitat metrics meaningful? • At what temporal scale do habitat metrics change? • Status of what? • Mean, Variance, Distribution • Trend of what? • Temporal, spatial?? • What does watershed condition mean?
Wenatchee Habitat Status Annual mean/variance Metric x Year Relative to what?
Variance Decomposition for Entiat metrics (2004-2008) Intolerant.Percent (asin) Intolerant.Percent Taxa Richness Shannon Pollution.Sensitive.Richness Evenness EPT.Richness EPT.Percent (asin) EPT.Percent FC_Total (log) FC_Total AvgOfStationEmbed (log) AvgOfStationEmbed PercentFinesLT16mm (asin) PercentFinesLT16mm PercentFinesLT006mm (asin) PercentFinesLT006mm (log) PoolCount AvgOfDensiometerReading TotalWoodVolume TotalWoodCount WetWidthDepthRatio StDevOfThalwegDepth AvgOfThalwegDepth StDevOfWettedWidth AvgOfWettedWidth StDevOfBankfullWidth log10AvgOfBankfullWidth AvgOfBankfullWidth
The full hierarchical model Regression Site-level Watershed-level Subbasin-level Factors Error
Model selection table -Parameters involved in selected models, DIC scores
So What? • Trends in habitat metrics exist • They exist at multiple spatial scales • Trend diversity exists in data space • How do we connect what we know about habitat metrics and our management questions? • What about habitat metric trends is biologically relevant? • Do indicators based on single habitat metrics mean anything? • Where are the fish in our consideration of habitat status and trends?
Habitat Status and Trends in the OkanoganOBMEP: Temperature Reporting 2010 Upper Columbia RTT Analysis Workshop Red Lion Hotel January 12, 2010 Presented by: Brent Phillips, R.P.Bio
BIOLOGIST/DATA MANAGER EXCHANGE WORKSHOP Annual - Status Panel - Status Annual - Trend Subwatershed - Map
DATA AUDITING RULE SET Finalized Data Auditing Rule Set (and order of implementation) • All temperatures below zero, will be changed to equal zero • Exclude the first and last days of each data series • When there is an hourly increment > 5 degrees C, exclude data records from that measurement until temperature recovers at least 3 degrees C. • If there are any remaining results > 30 degrees, data for the entire day will be excluded Final query develop – in progress
Okanogan Basin Habitat Status and Trends Jesse Schwartz Chip McConnaha
OBMEP Template SBP Template OBMEP Current SBP Patient
OBMEP Template SBP Template OBMEP Current SBP Patient
OBMEP Template SBP Template OBMEP Current SBP Patient
OBMEP Template SBP Template OBMEP Current SBP Patient
Next Steps • Deploy production version of EDT3 to implement status and trends report • Publish new user manual to guide users through the habitat status and trends evaluation process • The EDT3 model promises one of the few tangible methods for estimating changes in fish productivity to habitat restoration or degradation. • Stay tuned for more details in the next couple of years.
Habitat Status and Trend Conclusions • Report results for relevant metrics for use in adaptive management • Some changes at small spatial scales • More time is needed (Watershed scale change is slow and “noisy”) • Need to evaluate the validity of some metrics • If too much variance then change the KMQ • Data needed in Methow (update: funding has been allotted through the FCRPS BiOp)
Management Question Specificity Spatial Scale Columbia River General Count of ESU’s ESU ESU level criteria Count of Populations Population Population level criteria Species Specific Summations Species specific criteria Reach Average of metric Site Specific Direct measured metric Appropriate number of metric or indicators