Download
1 / 33
330 likes | 457 Views
Competition versus Capacity. Tim Fillingham, Chairman Aon Natural Resources & Construction, London. International Energy Trade World’s Oil 64% World’s Gas 26% World’s Coal 15%. Houston. problem. we. have a. International Energy Trade World’s Oil 64% World’s Gas 26% World’s Coal 15%.

E N D
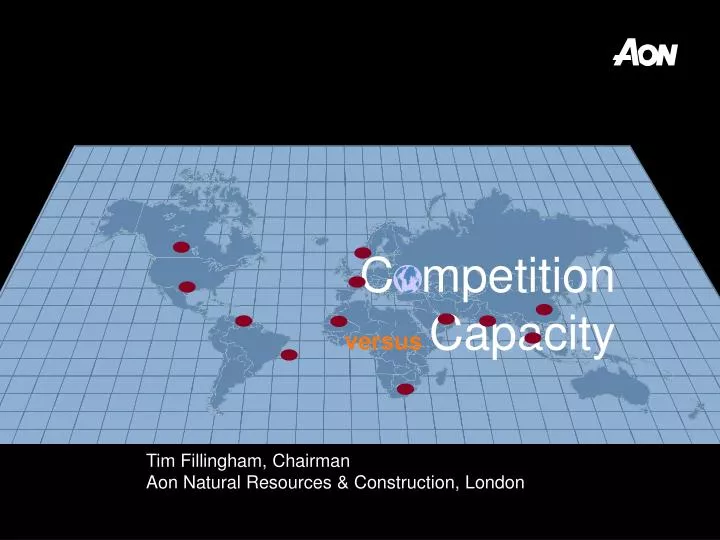
CompetitionversusCapacity Tim Fillingham, ChairmanAon Natural Resources & Construction, London
International Energy Trade World’s Oil 64% World’s Gas 26% World’s Coal 15%
Houston problem we have a International Energy Trade World’s Oil 64% World’s Gas 26% World’s Coal 15%
Houston problem we 2005: Energy underwriters are in the spotlight… have a • They are retaining more risk • They have suffered more losses • They can’t rely on investment income • They are under pressure to deliver underwriting profits • They know that others are keen to compete for their business • They are being watched by powerful people…
Increased “working” capacities Softening of overall property/casualty sector A dwindling premium base Market appetite forquality business Intelligent, model-drivenunderwriting More retained risk Impact of regulators, investors and analysts Impact of recent losses vs
$bn 20 18 16 14 US$bn 5.0 ? 12 4.5 10 4.0 3.5 8 3.0 2.5 6 2.0 4 1.5 1.0 2 0.5 0 0.0 1990 1991 1992 1993 1994 1995 1996 1997 1998 1999 2000 2001 2002 2003 2004 2005 * incurred to date So how did 2005 turn out? Estimated Worldwide Premium (US$) Losses excess US$1m 2005 2006 2007 Source:Willis/Aon Energy Loss Database
World’s ten most expensive insured losses Loss Insured loss (US$bn) Location Date • Hurricane Katrina 55.0 US 2005 • 9/11 20.0 US 2001 • Hurricane Andrew 21.5 US/Bahamas 1992 • Northridge earthquake 17.8 US 1994 • Hurricane Ivan 11.0 US/Caribbean 2004 • Hurricane Wilma 8-12 US 2005 • Hurricane Charley 8.0 US/Caribbean 2004 • Typhoon Mireille 7.8 Japan 1991 • Hurricane Rita 4-7 US 2005 • Windstorm Daria 6.6 France, UK 1990 Date 2005 2001 1992 1994 2004 2005 2004 1991 2005 1990 Loss Insured loss (US$bn) Location • Hurricane Katrina 55.0 US • 9/11 20.0 US • Hurricane Andrew 21.5 US/Bahamas • Northridge earthquake 17.8 US • Hurricane Ivan 11.0 US/Caribbean • Hurricane Wilma 8-12 US • Hurricane Charley 8.0 US/Caribbean • Typhoon Mireille 7.8 Japan • Hurricane Rita 4-7 US • Windstorm Daria 6.6 France, UK World’s ten most expensive insured losses Source: sigma, RMS, S&P estimates
In the wake of the storms Acute shortage of reinsurance & retrocession capacity Gulf of Mexico risks separated from the rest of the portfolio
“ Habib Kattansaid The modelling agencies have not covered themselves in glory in the last few years in any form. The predictive models are tools we all use but the robustness of those tools has not been truly tested. At best they were found wanting, at worst they were very flawed. They are selling themselves as the be all and end all for the market, but they are not. It is like ordering duck in a restaurant and getting chicken. ”
nature …but so does capital abhors a vacuum
Post-loss capital raising $ bn 35 30 Cat Bonds 25 Sidecars 20 Start Ups 15 10 1993 2002 2006
18 16 14 12 10 8 6 4 2 0 1993 1994 1995 1996 1997 1998 1999 2000 2001 2002 2003 2004 2005 2006 2007 Lloyd’s capacity Capacity (£bn) % Lloyd’s Names
Europe Beazley Catlin Chaucer Hiscox Imagine Kiln Liberty Synd Marketform Omega USA Ascot Beazley Catlin Hiscox Omega SINGAPORE Alba Amlin Argenta 1965 Ascot Beazley Catlin Chaucer Kiln Marine Markel Newline Asia Watkins China ACE Catlin Marlborough St Paul Trav Bermuda Advent Amlin Hiscox Kiln Omega Lloyd’s of London
What’s happened • Reinsurance Renewals • Too much capacity? • Florida Citizens Insurance • Securitisations 2007? in
Securitisations Cat-Mex Bond Thunderbird Re Bay Haven
A Cayman Islands SPV $200 million Floating Rate Notes 3 years from September 2006 9 Natural Catastrophe Swaps Qualifying Trigger Events North Atlantic Hurricane US Earthquake Japanese Typhoon & Earthquake European Windstorm Bay Haven
Bay Haven Loss Event 9 Loss Event 8 Senior Layer(rated AA) Loss Event 7 Loss Event 6 Mezzanine Layer(rated BBB-) Loss Event 5 Loss Event 4 Loss Event 3 Retained by Counterparty(no payout) Loss Event 2 Loss Event 1
£4,000 £3,000 £2,000 £1,000 £0 £1,000 £2,000 £3,000 85 86 87 88 89 90 91 92 93 94 95 96 97 98 99 00 01 02 03 04 05 06 Lloyd’s of London - PURE YEAR PROFIT/LOSS,1985-2006 (£m)
($bn) 2005 2006 Difference Allianz 5.96 9.55 3.59 AIG 10.48 14.05 3.57 XL (1.29) 1.70 3.01 Berkshire Hathaway 8.53 11.02 2.49 Swiss Re 1.92 3.81 1.89 Zurich 3.21 4.53 1.32 Ace 1.03 2.31 1.28 Munich Re 3.64 4.68 1.04 AXIS 0.09 0.93 0.84 AWAC (0.15) 0.47 0.62 Arch 0.26 0.69 0.43 Insurer results
…and the good headlines continue in 2007 Allianz AIG XL Berkshire Hathaway Swiss Re Zurich Ace Munich Re AXIS AWAC Arch successfully closes 2Q reports $8.4bn net income for H1 posts higher 2Q net and beats view 33% increase in 2Q net income 2Q net jumps 45%, outlook strong reports consensus beating H1 $2.68bn 2Q $649m up 13% post 2.2%2Q profit rise & ups 2007 target announces record 2Q $252m H1 2007 income up 18% to $237.2m H1 2007 income up 49% at $397.9m
2,800 2,600 2,400 2,200 2,000 1,800 2007 1,600 2005 1,400 1,200 1,000 Refineries Power Mining EAR Platforms E&P OEE OffshoreCAR Liabs Underwriting Capacities 2005-07 US$m
6,000 120 5,000 100 4,000 80 3,000 60 2,000 40 1,000 20 0 1993 1994 1995 1996 1997 1998 1999 2000 2001 2002 2003 2004 2005 2006 2007 0 Energy insurer capacities & average rating levels US$m % of 1992 rates Offshore Capacities Onshore Capacities Source: Aon Limited
Where are we heading? 2018 2009 2036 • Complex cycle dynamics • Conflicting demands of shareholders and policyholders
…AND NOW IT’S TIME FOR THE WEATHER 17 named storms - 9 hurricanes - 5 category 3 or above 74% probability of landfall along the US coastline 49% of a hurricane landfall on Gulf coast
“ Warren Buffett says… “ Were the terrible hurricanes of 2004 & 2005 aberrations? Or were they our planet’s first warning that the climate of the 21st century will differ materially from what we’ve seen in the past? If the answer is yes, then 2006 will soon be perceived as a misleading period of calm preceding a series of devastating storms. These could rock the insurance industry. I do not know what lies ahead but I do know that it would be a huge mistake to bet that atmospheric changes are benign in their implications for insurers.
300 250 200 150 100 50 0 1970 1976 1982 1988 1994 2000 2006 Loss trends Man made disasters Natural Catastrophes
Record profitsfor insurers&reinsurers morecompetitive marketplace anddeclining pricing
Increasing capacity… Record profitsfor • Existing markets • New entrants • Capital markets insurers&reinsurers
Increasing capacity… • Existing markets • New entrants • Capital markets fragility to the current trends
fragility to the current trends Thankyoufor your time Tim Fillingham Chairman Aon Natural Resources & Construction, London