Download
1 / 35
350 likes | 450 Views
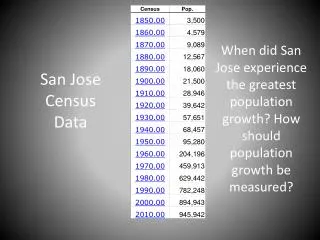
San Jose Demographic Findings and Trends, Census 2010. Michael Bills, Senior Planner City of San Jose March 16, 2012. Population Growing…But at a Slower Rate. 37%. 24%. 14%. 6%. Population Growth by Decade. Source: U.S. Census Bureau. Net Increase= 50,999. Annual Average= 5,100.

E N D
San Jose Demographic Findings and Trends, Census 2010 Michael Bills, Senior Planner City of San Jose March 16, 2012
Population Growing…But at a Slower Rate 37% 24% 14% 6% Population Growth by Decade Source: U.S. Census Bureau
Net Increase= 50,999 Annual Average= 5,100 Significant Year-to-Year Growth Variation Annual Population Change Source: U.S. Census Bureau & California Department of Finance
Growth from Immigration and Natural Increase; Domestic Migration was Negative Population Change for Santa Clara County, 2000-2010 Source: California Department of Finance
A City of Immigrants Source: U.S. Census Bureau
3/4 of Foreign Born From One of Five Countries Source: U.S. Census Bureau
We Are Getting Older… A DecadeOlder! Median Age Source: U.S. Census Bureau
…But Are Still Relatively Young Median Age, 2010 Source: U.S. Census Bureau
Median Age: Large Council District Variation Average35.2 Median Age by Council District, 2010 Source: U.S. Census Bureau
Young Population Declined; Boomers Headed To Senior Status Percent Change by Age Group, 2000-2010 Source: U.S. Census Bureau
Seniors Pre-Retirement Mid-Career Young Adults Children and Youth Population Pyramid: A “Top-Heavy” Shape Male Female Grouped Age Cohorts by Gender, 2010 Source: U.S. Census Bureau
Kids a Declining Share; Seniors Continue to Increase Proportion of Children and Seniors in all Residents Source: U.S. Census Bureau
Race/Ethnicity: A “City of Thirds” Major Race Groups, 2010 Source: U.S. Census Bureau
Hispanic and Asian Share Increased; White Share Declined Major Race and Ethnic Groups, Share of Population Source: U.S. Census Bureau
Race Majority by Council District • Existing Hispanic majority maintained in D3 (52%) and D5 (62%), and high Hispanic concentration remained in D7 (48%) • Existing Asian majority maintained in D4 (61%), and new Asian majority created in D8 (53%) • Existing White majority maintained in D9 (59%), but White majority no longer present in D6 (49%) and D10 (47%)
1/3 of Population is Asian Vietnamese11% Chinese7% Filipino6% Asian Indian5% Mixed/Other5% Asian Race Distribution, 2010 Source: U.S. Census Bureau
Asian Indians Grew Fastest; Whites and Blacks Declined Change in Major Race/Ethnic Groups, 2000-2010 Source: U.S. Census Bureau
Household Size Declined, Reversing Prior Trend Average Household Size Source: U.S. Census Bureau
Household Size: Large Race/Ethnic Variation Average= 3.1 Average Household Size by Race/Ethnicity, 2010 Source: U.S. Census Bureau
Household Size: Large Council District Variation Average= 3.1 Average Household Size by Council District, 2010 Source: U.S. Census Bureau
1-of-5 Households are Now Singles Household Type, 2010 Source: U.S. Census Bureau
Family Households: 81% of Growth wasHouseholds Without Children; Now a Majority Family Households by Presence of Children, 2000-2010 Source: U.S. Census Bureau
8% of Households are Multigenerational A "multigenerational" household has 3+ generations Multigenerational Households, 2010 Source: U.S. Census Bureau
Educational Attainment: High and Rising Educational Attainment, Population Age 25+ Source: U.S. Census Bureau
Household Income: 2/3 Earn Over $50,000 Household Income, 2010 Source: U.S. Census Bureau
Housing: 58% Own, 42% Rent Housing Tenure, 2010 Source: U.S. Census Bureau
Over 60% of Whites and Asians Own; Hispanics and Blacks ~35%-41% Housing Tenure by Race/Ethnicity, 2010 Source: U.S. Census Bureau
More than Half of Population Speaka Non-English Language at Home Language Spoken at Home, 2010 Source: U.S. Census Bureau
Limited English Varies; Trending Down Overall Language Spoken at Home by Major Language Groups, 2010 Source: U.S. Census Bureau
Limited English by Select Asian Languages Language Spoken at Home by Select Asian Languages, 2010 Source: U.S. Census Bureau
In Closing • Questions • Comments • Discussion Maps, data, and presentation available at: www.sanjoseca.gov/redistricting/2011redistricting.asp