Download
1 / 37
390 likes | 552 Views
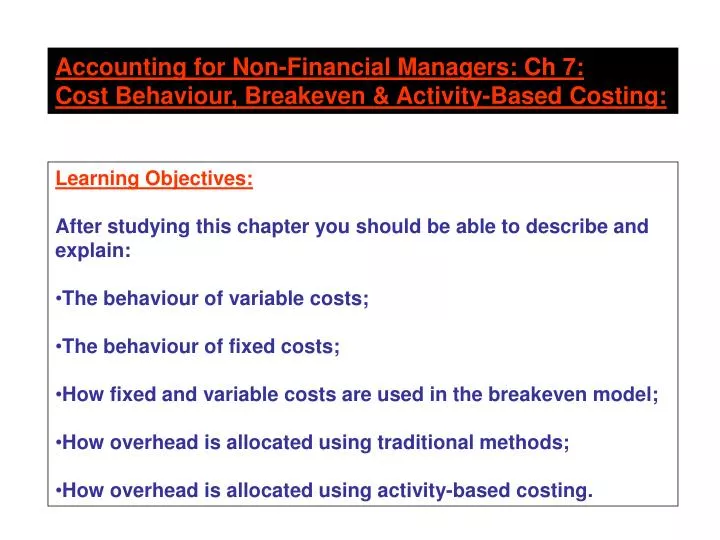
Accounting for Non-Financial Managers: Ch 7: Cost Behaviour, Breakeven & Activity-Based Costing:. Learning Objectives: After studying this chapter you should be able to describe and explain: The behaviour of variable costs; The behaviour of fixed costs;

E N D
Accounting for Non-Financial Managers: Ch 7: Cost Behaviour, Breakeven & Activity-Based Costing: • Learning Objectives: • After studying this chapter you should be able to describe and explain: • The behaviour of variable costs; • The behaviour of fixed costs; • How fixed and variable costs are used in the breakeven model; • How overhead is allocated using traditional methods; • How overhead is allocated using activity-based costing.
Variable costs To plan and control costs it is necessary to know how they behave. A simple model of cost behaviour is that all costs can be described as either variable or fixed. A variable cost is one that changes in response to changes in activity (output). Examples: raw materials, direct labour, sales commissions. The more products that are made, the greater will be the total dollar cost of each of these.
Fixed costs: To plan and control costs it is necessary to know how they behave. A simple model of cost behaviour is that all costs can be described as either variable or fixed. A fixed cost is one that stays the same when activity (throughput) changes: Examples: rent, management salaries, marketing expense. All these stay the same dollar value no matter how much business is done.
Mixed Costs: Some costs have both a variable component and a fixed component. A bill for electricity, for example, may contain a fixed charge per month plus a variable element that depends on how much power was used. The accountant will have to separate the two components so that each can be treated in the appropriate way. Toronto Hydro: Bill for January: Standing charge for rated capacity: $ 5,000 (fixed) Usage: 150,000 KwH @ $0.10 per unit: 15,000(variable) Total: $20,000
Contribution Margin: Selling price per unit: Less: variable cost per unit: = contribution margin per unit. The contribution margin per unit measures the advantage gained from selling one additional unit of product or service. It also measures the harm suffered when selling one unit fewer.
Calculating Operating Profit: Total sales revenue: less: total variable cost: (a $ amount per unit or a percentage of sales revenue) = total contribution margin: Less: fixed cost: (a lump sum: so many $ per month or year) = operating profit.
Calculating Operating Profit: The product is sold for $100 per unit: Variable cost is budgeted to be 75% of sales revenue ($75/unit): Fixed cost is budgeted to be $50,000 per month. Units sold: 1,000 2,000 3,000 4,000 Sales revenue: $100,000 $200,000 $300,000 $400,000 Variable cost: 75,000150,000225,000300,000 Contribution margin 25,000 50,000 75,000 100,000 Fixed cost 50,000 50,000 50,000 50,000 Operating income $ (25,000) nil$ 25,000$ 50,000 The more you sell, the bigger the operating profit.
Calculating Operating Profit: • The product is sold for $100 per unit: • Variable cost is budgeted to be 75% of sales revenue ($75/unit): • Fixed cost is budgeted to be $50,000 per month. • Units sold: 1,000 2,000 3,000 4,000 • Sales revenue: $100,000 $200,000 $300,000 $400,000 • Variable cost: 75,000150,000225,000300,000 • Contribution margin 25,000 50,000 75,000 100,000 • Fixed cost 50,000 50,000 50,000 50,000 • Operating income $ (25,000) nil$ 25,000$ 50,000 • Break-even point • When sales are less than $200,000 there will be an operating loss; • When sales are more than $200,000 there will be an operating profit; • When sales are exactly $200,000 there will be neither loss nor profit: the company will break-even.
Break-Even Point: Every unit sold creates one unit of contribution margin; When there are enough units sold the total contribution margin is enough to pay the fixed costs. At that point the company has achieved break-even: it will earn neither profit nor loss.
The Breakeven Chart: Revenues And costs $400,000 $300,000 $200,000 $100,000 $ 0 0 1,000 2,000 3,000 4,000 Units sold fixed cost ($50,000) $ 50,000
The Breakeven Chart: Revenues And costs $400,000 $300,000 $200,000 $100,000 $ 0 0 1,000 2,000 3,000 4,000 Units sold variable cost: (75% of sales revenue or $75 per unit)
The Breakeven Chart: Revenues And costs $400,000 $300,000 $200,000 $100,000 $ 0 0 1,000 2,000 3,000 4,000 Units sold total cost: (fixed cost + variable cost) $ 50,000
The Breakeven Chart: Revenues And costs $400,000 $300,000 $200,000 $100,000 $ 0 0 1,000 2,000 3,000 4,000 Units sold revenue: $100 per unit
The Breakeven Chart: Revenues And costs $400,000 $300,000 $200,000 $100,000 $ 0 0 1,000 2,000 3,000 4,000 Units sold revenue total cost
The Breakeven Chart: Revenues And costs $400,000 $300,000 $200,000 $100,000 $ 0 0 1,000 2,000 3,000 4,000 Units sold revenue total cost break-even point: 2,000 units; sales revenue & costs both = $200,000
The Breakeven Chart: Revenues And costs $400,000 $300,000 $200,000 $100,000 $ 0 0 1,000 2,000 3,000 4,000 Units sold revenue profit total cost Break-even point: 2,000 units; sales revenue & costs both = $200,000 loss
Breakeven Point: Breakeven occurs when there is enough contribution margin to pay all fixed costs: Contribution margin: Sales revenue per unit less variable cost per unit. Breakeven: Total fixed cost/contribution margin Suppose: Sales revenue is $100 per unit Variable cost is budgeted to be 75% of sales revenue. Fixed cost is budgeted to be $50,000 per month. Contribution margin: $100 - $75 = $25 per unit Fixed cost: $50,000 Breakeven point: $50,000/$25 = 2,000 units At 2,000 units/month you will break even; At less than 2,000 units/month you will show a loss; At more than 2,000 units/month you will show a profit.
Tony’s Drinks: Selling price: $0.80 per drink Variable cost: $0.50 per drink Contribution margin: $0.30 per drink Fixed cost: $180 per day Breakeven : fixed cost/contribution margin $180/$0.30 = 600 drinks per day Tony needs to sell 600 drinks per day to break-even.
Tony’s Drinks: Selling price: $0.80 per drink Variable cost: $0.50 per drink Contribution margin: $0.30 per drink Fixed cost: $180 per day Breakeven : fixed cost/contribution margin $180/$0.30 = 600 drinks per day If Tony sells 850 drinks per day his operating profit will be $75: Operating profit = (contribution margin * number of units sold) - fixed cost: Operating profit = ($0.30 * 850) - $180 = $75
The Breakeven Chart: Tony’s Drinks: Revenues And costs $1,000 $ 800 $ 600 $ 480 $ 400 $ 200 $ 180 $ 0 0 200 400 600 800 1,000 Units sold Sales revenue: $0.80 per drink Total cost: $180 + $0.50 per drink Fixed cost ($180)
The Breakeven Chart: Tony’s Drinks: Revenues And costs $1,000 $ 800 $ 600 $ 480 $ 400 $ 200 $ 180 $ 0 0 200 400 600 800 1,000 Units sold Sales revenue: $0.80 per drink Total cost: $180 + $0.50 per drink Break-even: 600 drinks Fixed cost ($180)
Tony’s Drinks: Selling price: $0.80 per drink Variable cost: $0.50 per drink Contribution margin: $0.30 per drink Fixed cost: $180 per day Breakeven : fixed cost/contribution margin $180/$0.30 = 600 drinks per day Suppose Tony wants to make a profit of $120 per day: He now needs to sell 1,000 drinks: (fixed cost + required profit) - (contribution margin * # units) = $0 ($180 + $120) - (n * $0.30) = $0 $300 = $0.3 * n n = 1,000 A figure of “required profit” is like a fixed cost: it does not change and it has to be covered by the contribution margin.
Tony’s Drinks: Selling price: $0.80 per drink Variable cost: $0.50 per drink Contribution margin: $0.30 per drink Fixed cost: $180 per day Suppose Tony raises the price from $0.80 to $1.00: This is expected to decrease volume to 600 units: This also raises the contribution margin per unit: At $1 selling price contribution margin is $0.50 ($1 - $0.50): At c.m. of $0.5 and volume of 600 total contribution margin is $300. This is enough to pay the fixed costs ($180) and leave a profit of $120. His profit objective has been more than met.
Tony’s Drinks: Selling price: $0.80 per drink Variable cost: $0.50 per drink Contribution margin: $0.30 per drink Fixed cost: $180 per day Suppose that lowering the price from $0.80 to $0.70 will increase expected volume to 1,600 units: At $0.70 selling price contribution margin is $0.20 ($0.70 - $0.50): At c.m. of $0.20 and volume of 1,600 total contribution margin is $320: This is enough to pay the fixed costs ($180) and leave a profit of $140. His profit objective has been met (even exceeded).
Tony’s Drinks: Selling price: $0.80 per drink Variable cost: $0.50 per drink Contribution margin: $0.30 per drink Fixed cost: $180 per day Advertising would increase the fixed cost by $60 per day; This is expected to increase volume by 250 units; Additional contribution margin: $0.3. * 250 = $75 Additional cost of advertising: $60 Net benefit of advertising: $15
Activity-Based Costs: Splitting costs into variable costs and fixed costs is very effective in simple situations: e.g. retailing fashion goods. More complex situations are frequently found in reality: i) multiple product lines with different contribution margins; ii) “fixed costs” are often driven by factors such as batch size; product & process complexity; product range etc. A more sophisticated cost analysis is found in “activity-based costing. Here the causes of costs (cost drivers) are used to predict and allocate overhead costs.
Traditional overhead cost allocation: Direct costs such as materials and labour can generally be traced precisely to the products that caused them. Overhead is more problematical Madoc Inc. makes hole punches and staplers. Production is expected to incur total overhead of $64,000 per month. They expect to use 16,000 machine hours per month. Their budgeted overhead recovery rate is $4 per machine hour: ($64,000 overhead / 16,000 machine hours = $4/machine hour). Every time a product uses an hour of machine time it will be charged with $4 of overhead. Hole punches are charged with 10,000 * $4 = $40,000 overhead Staplers are charged with 6,000 * $4 = $24,000 overhead. As long as machine hour use and overhead are closely connected this is a reasonable approach.
Madoc Inc:Traditional Cost Allocation: Hole punchesStaplersTotal Sales units 50,000 20,000 70,000 Selling price $1.64 $2.50 Sales revenue $82,000$50,000$132,000 Direct costs: raw materials $18,000 $ 8,000 $ 26,000 labour 9,000 4,000 13,000 27,000 12,000 39,000 Allocated overhead** 40,00024,000 64,000 Total cost 67,000 36,000 103,000 Operating profit $15,000$14,000$ 29,000 Operating profit as % of sales: 18.3% 28.0% 22.0% Machine hours 10,000 6,000 16,000
Activity-Based Costing: In activity-based costing overhead is analyzed into a number of different cost pools, each one of which is driven by a different cost driver or activity. The use of these cost drivers (activities) by each product is measured and the overhead allocation becomes far more precise.
Activity-Based Costing at Madoc Co.: The overhead at Madoc Co. has been investigated and the following cost pools have been selected: Unit variable costs: $ 7,000 Batch variable costs: 35,000 Product sustaining costs: 6,000 Sub-total: $48,000 Business sustaining costs: 16,000 Total overhead: $64,000
Unit Variable Costs: $7,000 $7,000 of the overhead consists of costs that vary with the number of units produced. This might include electric power, depreciation etc. A total of 70,000 items were produced, so this cost pool will be charged to products at $0.10 per unit. Hole punches (50,000 units) will be charged $5,000; Staplers (20,000 units) will be charged $2,000.
Batch-Related Costs: $35,000: $35,000 of the overhead consists of costs related to setting up production batches. A total of 14 batches were run, so each batch caused $2,500 of overhead. Hole punches, which had four large batches, will be charged $10,000; Staplers, which had ten small batches, will be charged $25,000, even though they produced fewer units.
Product-Sustaining Costs: $6,000 of the overhead was caused by design changes and other product-related costs. Hole punches, which had few design changes, will be charged with $1,000. Staplers, which are frequently redesigned, will be charged with $5,000, even though they produced fewer units.
Unallocated Overhead: $16,000 of overhead was discovered to be “business sustaining”, meaning that it could not be related to any specific product related activities. Under activity-based costing this would not be allocated to either product. It would be treated as general corporate overhead.
Madoc Inc: Activity-Based Product Costing: Hole punchesStaplersTotal Sales units 50,000 20,000 70,000 Selling price $1.64 $2.50 Sales revenue $82,000$50,000$132,000 Direct costs: raw materials $18,000 $ 8,000 $ 26,000 labour 9,000 4,000 13,000 (no change so far) 27,000 12,000 39,000 Overhead: unit related costs 5,000 2,000 batch related costs 10,000 25,000 product sustaining 1,000 5,000 16,000 32,000 48,000 Total product cost 43,000 44,000 97,000 Product profitability $39,000$ 6,000 $ 45,000 Profit as % of sales 47.6% 12.0% 34.1% Business sustaining costs (not allocated) 16,000 Operating profit $ 29,000 The judgement about relative product profitability is reversed!
Activity-Based Costing for Customer Profitability Analysis: Profit generally follows sales volume. This will be untrue where different customers have different contribution margins (i.e. where the selling price is different between customers; This will also be untrue where costs differ between customers. ABC can also be used to discover which customers are more profitable than others by identifying such things as customer specific costs.
Using Activity-Based Costing to Assess Customer Profitability: Customer Activated 4 smaller Total hardwarecustomers Sales revenue $5,000,000 $5,000,000 $10,000,000 Cost of goods sold (75%) 3,750,000 3,750,000 7,500,000 Contribution margin $1,250,000$1,250,000$ 2,500,000 Customer specific costs: 5% discount 250,000 sales staff 150,000 100,000 delivery costs 375,000 125,000 $ 775,000$ 225,000$ 1,000,000 Customer profitability $ 475,000$1,025,000$ 1,500,000 Profit as % of sales 9.5% 20.5% 15.0% The point: knowing which customers are less profitable enables you to actively manage them. Knowing where the costs are incurred enables you to concentrate your efforts on the things that matter.