Download
1 / 15
170 likes | 404 Views
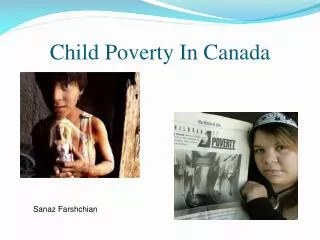
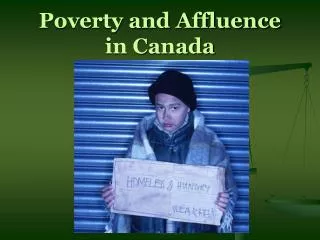
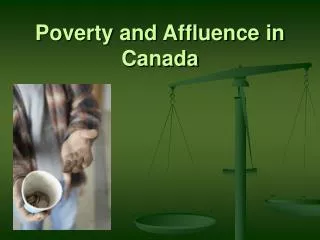
Poverty in Canada. Income Distribution. To examine income distribution, economists divide Canadian income earners into groups called “quintiles” A quintile represents 1/5 or 20% of the total number of earners First quintile = lowest earners etc. Measuring Poverty.

E N D
Income Distribution • To examine income distribution, economists divide Canadian income earners into groups called “quintiles” • A quintile represents 1/5 or 20% of the total number of earners • First quintile = lowest earners etc.
Measuring Poverty • What does it mean to be poor? • What characteristics does poverty involve? • Economists disagree as to how they should determine who is poor, why people become poor and what needs to be done to reduce poverty
Absolute Poverty • A state of utter destitution • Due to Canada’s social welfare system, the incidence of this extreme form of poverty is rare in Canada
Relative Poverty • Not necessarily a Canadian that lacks food, safe water, shelter, or clothing • A Canadian that feels poor and that other Canadians see as poor compared to (relative to) others
Low-Income Cut-Off • Developed by Stats Canada in 1968 • Used to identify income levels below which a household is statistically classified as being in a relatively limited income situation
Low-Income Cut-Off • Average Canadian household spends 35% of its before-tax income on food, clothing, and shelter • A household that is “relatively worse off” spends more than 20% above the national average on the three necessities
Before/After Tax Income • LICO’s are calculated using both before-tax income and after-tax income • Before-tax income is easier to calculate, but after-tax income is used more…why?
Before/After Tax Income • …because it provides a truer picture. All necessities are purchased with after-tax dollars • Money that people really do not have would have been considered.
Poverty Line • LICO’s are often used by analysts as indications of poverty • Media often refers to LICO’s as “poverty lines” • They have no officially recognized status, and Stats Canada does not promote the use of the term LICO in this way.
The Poor • The working poor – people who work, but whose wages do not keep them out of poverty (absence of unions, market power of employers) • The welfare poor – people who do not work and are experiencing poverty (elderly, poor health, single parents, job loss)
Welfare State • Early in the 20th century, Canada established a “welfare state” • Philosophy – that governments should use social programs and transfers financed out of taxation to help people who are poor, suffer illness, or are otherwise disadvantaged.
Progressive Tax System • First step of the welfare state was to allow low-income earners to keep most of the money they make • Progressive Tax System – taxes higher-income at a higher percentage. The more you make the more tax you pay.
Attacking Poverty • Programs to combat poverty can be divided into two broad but overlapping categories: • Structural Strategies • Relief Strategies
Attacking Poverty • Structural Strategies – attempt to eliminate the causes of poverty (long term) • Relief Strategies – immediate support (food banks, government transfers). Often criticized as “band-aid solutions”