Download
1 / 31
310 likes | 377 Views
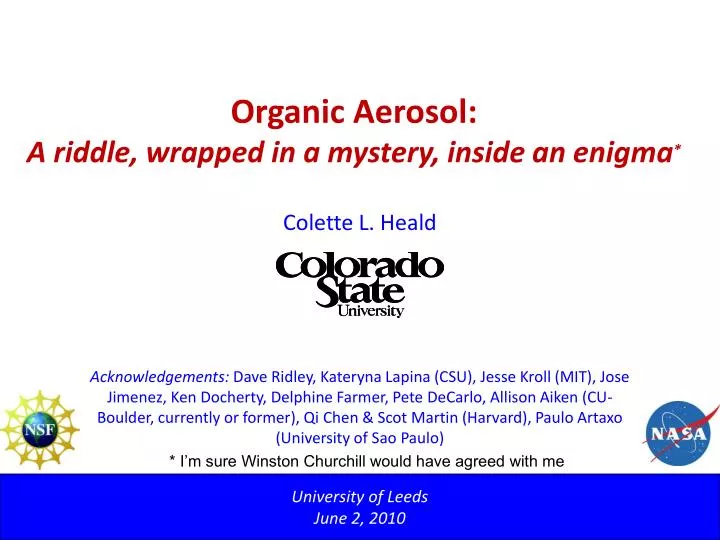
Organic Aerosol: A riddle, wrapped in a mystery, inside an enigma *. Colette L. Heald

E N D
Organic Aerosol: A riddle, wrapped in a mystery, inside an enigma* Colette L. Heald Acknowledgements: Dave Ridley, Kateryna Lapina (CSU), Jesse Kroll (MIT), Jose Jimenez, Ken Docherty, Delphine Farmer, Pete DeCarlo, Allison Aiken (CU-Boulder, currently or former), Qi Chen & Scot Martin (Harvard), Paulo Artaxo (University of Sao Paulo) * I’m sure Winston Churchill would have agreed with me University of Leeds June 2, 2010
AEROSOL: CONNECTION TO BIG RESEARCH TOPICS IN ENVIRONMENTAL SCIENCE…A MOTIVATION TO GET IT RIGHT! AIR QUALITY / HEALTH CLIMATE VISIBILITY BIOSPHERE-ATMOSPHERE Clear Day
ORGANIC AEROSOL IN PARTICULAR… Primary Organic Aerosol: emitted Secondary Organic Aerosol: formed + oxidants Hydrocarbons (gas-phase & particulate) Terpenes (gas-phase) PBAP ANTHROPOGENIC NATURAL
MOTIVATION #1: ORGANIC AEROSOL MAKES UP AN IMPORTANT FRACTION OF OBSERVED AEROSOL Sulfate Organics [Zhang et al., 2007] Globally makes up 25-75% of total fine aerosol at the surface (ignoring soot here)
MOTIVATION #2: ORGANIC AEROSOL MAY BECOME EVEN MORE IMPORTANT IN THE FUTURE! SULFATE Present-Day Burden: 1.5-2.1 Tg1 Projection:↓ by > 50% by 2100? OA ? OA Burden Present-Day Burden: ? (models ~1.6 Tg) Projection: ? [Heald et al., 2008] Andreae et al. [2005] suggest ↓ sulfate will accelerate greenhouse gas warming, but organics could compensate… 1 [Koch et al., 1999; Barth et al., 2000; Takemura et al., 2000]
MOTIVATION #3: DEFINING THE “NATURAL” BACKGROUND Estimating the “natural” background is CRITICAL for the indirect effect – how much have CCN values increased?? Pre-industrial values? July 97 [Spracklen et al., 2005] • More broadly, • How much is anthropogenic (controllable) • Can we predict how the natural fraction will respond to climate change?
CHALLENGES IN MODELING THE RIGHT LEVELS OF OA AMMA ITCT-2K4 IMPEX AMAZE-08 Egbert [Volkamer et al., 2006] SOA measured/modeled = 4-100! Models do get it right sometimes (even more puzzling?) but is it for the right reason?
WHY DON’T MODELS GET IT RIGHT…. 10,000’s of (unidentified?) compounds with variable properties Continuing Oxidation/Partitioning in the Atmosphere Uncertain Formation (Missing sources? Poorly understood processes?) Hydrocarbons (gas-phase & particulate) Terpenes (gas-phase) PBAP
FOCUS ON TODAY: (1) Trying to simplify our description of organic aerosol composition H:C (2) Look at whether measurements of AOD from space can shed any light on the budget of OA O:C
HOW ATMOSPHERIC AGING CAN CHANGE OA COMPOSITION OXIDATION: Functionalization Fragmentation (break C-C bonds) OH Volatility Composition may change (depends on where bond breaks and what caps end) Volatility Generally O:C VOLATILIZATION/CONDENSATION: More oxygenated material pulled into aerosol. PHYSICAL MIXING: Mean composition reflecting constituent air masses Organic Aerosol Composition is DYNAMIC – what a headache for modeling!
A SIMPLIFIED DESCRIPTION OF ORGANIC AEROSOL COMPOSITION 2D chromatogram of OA Alternate: Look at bulk elemental composition of aerosol Hydrogen Carbon Other (N, S, etc) Oxygen [Goldstein et al., 2008] Typically < 20% of OA mass can be identified [Williams et al., 2007]. Even if we could identify these species, global models couldn’t handle this complexity! Need a framework to compare composition & track changes…
THE VAN KREVELEN DIAGRAM Developed by Van Krevelen in 1950’s to describe oil formation Simple way to visualize changing composition
HOW DOES FUNCTIONALIZATION CHANGE AEROSOL COMPOSITION? If replace aliphatic carbon (-CH2-) with functional group, composition changes as follows: Example: Replace -CH2- with a carbonyl group -C(=O)- Add 1O, lose 2H, slope = -2
LAB & FIELD ORGANIC AEROSOL LINE UP IN A VAN KREVELEN DIAGRAM! All measurements taken with the high resolution Aerosol Mass Spectrometer (HR-AMS) Surprisingly, despite complexity, aerosol composition changes during aging looks like carboxylation! [Heald et al., 2010]
EXAMPLES FROM THREE FIELD CAMPAIGNS… Riverside, California: dominated by urban sources Amazon basin: clean, low loadings, more oxygenated Mexico city (aircraft): regional sampling (clean & polluted) Photochemical clock shows moves “down” the line with aging. Some leveling off with long ages?
WHAT DOES THIS TELL US ABOUT PROCESSES AND/OR COMPOSITION? Isoprene Tetrols Monocarboxylic Acids → Glyoxal Oligomers Lipids Dicarboxylic Acids Proteins Cellulose SOA Lignin Tannins Observed OA Condensed Hydrocarbons *regions overlaid from Wozniak et al., 2008 Suggests that oligomerization is not the dominant aging process. Suggests that glyoxaloligomers and isoprene tetrols do not make up major fraction of mass.
IMPLICATIONS • 1. From a modeling perspective: hope for a simple parameterization! • Need to understand aging timescale better (how fast do we move down the -1 slope?) H:C O:C … From a lab perspective: why does bulk OA “collapse” to this composition? What are the details of fragmentation & functionalization reactions in the atmosphere that result in net carboxylation? Acknowledgements: Jesse Kroll (MIT), Jose Jimenez, Ken Docherty, Delphine Farmer, Pete DeCarlo, Allison Aiken (CU-Boulder, currently or former), Qi Chen & Scot Martin (Harvard), Paulo Artaxo (University of Sao Paulo)
FOCUS ON TODAY: (1) Trying to simplify our description of organic aerosol composition H:C (2) Look at whether measurements of AOD from space can shed any light on the budget of OA O:C
A LARGE MISSING SOURCE OF ORGANIC AEROSOL? Goldstein and Galbally [2007] suggest that SOA source may be anywhere from 140-910 TgC/yr. TgC yr-1 For comparison, current model (GEOS-Chem) estimates total ~50 TgC/yr (~2/3 POA, 1/3 SOA), equivalent burden ~0.81 TgC Can total aerosol optical depth (AOD) measurements shed any light on the total budget of OA?
SOME CHALLENGES… • AOD is an integrated measure of ALL aerosols. • Satellite AOD observations don’t always agree, AERONET coverage sparse Example of MODIS/MISR/AERONET (MAM 2008) MODIS MISR Strategy: focus on continental AOD, use MISR as a global constraint
DO OBSERVATIONS SUPPORT MISSING SOURCE(S) OF OA? DJF JJA Model does underestimate observed AOD in most regions/seasons.
IF ONLY AEROSOL IN THE ATMOSPHERE WAS OA, WHAT LOADING IS IMPLIED BY SATELLITE AOD? Calculate the “hypothetical” AOD implied by a constant 1 g/m3 profile over the land, and see how we need to scale this locally to make up ENTIRE AOD reported by MISR. Inverted total MISR AOD: Equivalent uniform OA profile OA loading is 3.7 TgC (~230 TgC/yr) over land extrapolate to include outflow ~460 TgC/yr. (middle of Goldstein & Galbally range)
A MORE REALISTIC POSSIBILITY:ATTRIBUTE ALL OF MODEL UNDERESTIMATE TO OA(assuming all the negative bias is ONLY OA) DJF Biofuels? Agriculture Possibly dust? JJA • Estimate that ~95 TgC/yr over land required to close the MISR-GEOS-Chem discrepancy. • extrapolate to global ~200 TgC/yr (approximately 4 times current model OA source) • IF we remove N. Africa & the Middle East (dust) from this, total is reduced to ~160 TgC/yr • Likely still too high…
UNCERTAINTIES ATTRIBUTED TO VERTICAL DISTRIBUTION Uniform vertical profile perhaps not very realistic… If the same mass is distributed with exponential drop off (atmospheric scale height assumed) , the AOD increases by 15%. 1 2 OA [g/m3] OA burden implied by AOD would be 15% lower (140 TgC/yr) if distributed exponentially. Surface concentrations would be ~ twice as high.
SEASONALITY OF “INVERTED” OA BURDEN Seasonality of “inverted” OA peaks in local spring/summer Coincident to peak in BVOC & oxidants…
COMPARISON AT AERONET SITES DJF MAM GEOS-Chem simulation GEOS-Chem + “extra” AOD Adding “extra AOD” observed by MISR does improve model ability to capture both magnitude and variability of AERONET AOD JJA SON
DO THE SURFACE OBSERVATIONS OF OA SUPPORT A SIMILAR CONCLUSION? Monthly mean GEOS-Chem simulation (for 2003) sampled at sites from Zhang et al, [2007] (AMS observations from 2000-2006 not exactly matched) Surface OA (including inverted) Surface OA Vancouver (removing Beijing & Mexico) Beijing (32 g/m3) // ACE-Asia Mexico (22 g/m3) Storm Peak Jungfraujoch Duke Forest Duke Forest Tokyo (winter) Jungfraujoch Taunus Riverside Fukue (May) Model does generally underestimate surface OA. “Inverted” surface OA will depend on vertical distribution (use here constant profile). Adding inverted OA marginally improves ability to capture AMS magnitude and variability. The data set is limited geographically.
SENSITIVITY OF ORGANIC AEROSOL OPTICS Assumed optical properties based on GADS database and log-normal size distribution recently evaluated by Drury et al. [2010] Uncertainty in simulated AOD due to optical properties a factor of 0.5-1.5
HAVE WE REDUCED THE UNCERTAINTY ON THE OA BUDGET? Goldstein and Galbally [2007] 910 TgC/yr 460 TgC/yr If all AOD inverted for OA Range estimated from uncertainty in optical properties If attribute all MISR “excess” AOD to OA 200 TgC/yr 160 TgC/yr If remove Africa & Middle East 140 TgC/yr 140 TgC/yr Account for “likely” vertical distribution 50 TgC/yr Existing GEOS-Chem sources [Heald et al., in prep] Observations support a continental OA source of 140 TgC/yr (or less).
WHAT ABOUT MARINE SOURCES OF OA? Spracklen et al., [2008] estimate source of 4 TgC/yr, Roelofs et al., [2008] estimate 75 TgC/yr, Gantt et al. [2009] estimate 22.3 TgC/yr , Vignati et al. [2010] estimate 4.1 TgC/yr Spracklen et al, annual mean marine OA emissions What about in terms of AOD? Oceanic AOD is underestimated in the model – patterns seem to match the marine OA estimated by Spracklen et al. [2008], but scaling up source by a factor of 10 required. Kateryna Lapina
HAVE WE REDUCED THE UNCERTAINTY ON THE OA BUDGET? Goldstein and Galbally [2007] 910 TgC/yr Suggests a MAXIMUM global source of ~180 TgC/yr of OA to the atmosphere. This is more than THREE TIMES what is currently included in global models…. BUT at the low end of Goldstein & Gallbally [2007] range. 180 TgC/yr MARINE 140 TgC/yr CONTINENTAL