Download
1 / 36
380 likes | 614 Views
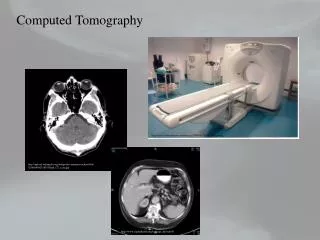
Thermoacoustic Tomography. G Ambartsoumian Texas A&M D Finch Oregon State University SK Patch* GE Healthcare Rakesh U. Delaware. An Inherently 3D Generalized Radon Inversion Problem. Xrays propagate straight through, image recovery stable.

E N D
Thermoacoustic Tomography G Ambartsoumian Texas A&M D Finch Oregon State University SK Patch* GE Healthcare Rakesh U. Delaware An Inherently 3D Generalized Radon Inversion Problem
Xrays propagate straight through, image recovery stable. Sound waves also propagate, permitting stable inversion. supp f Outline • WHY TCT – images, ... • Ties to wave equation • Physics - forward problem • Inversion formulae for complete data • Inverting incomplete data Backup • Wave Fronts • Recon Background • Xray CT • Spherical Transforms NIR diffuses. . .
MRI slice US TCT slice Xray projection optical ART Kruger/OptoSonics, Inc. UW-Madison TransScan R&D Images across modalities Prototype TCT already competes w/conventional scans! EIT TransScan R&D
Ductal Carcinoma in situ (DCIS) Images courtesy R. Kruger, OptoSonics, Inc.
TCT Changes During Chemo (TCT V2.4) Baseline 7 weeks Pre-Surgery Longitudinal changes during primary chemotherapy. Tumor mass (arrows) appears to have decreased markedly. Images courtesy R. Kruger, OptoSonics, Inc.
cyst cysts Fibrocystic Breast(Extra Dense Breast) Images courtesy R. Kruger, OptoSonics, Inc.
C t C t Thermoacoustics (Kruger, Wang, . . . ) breast waveguides Kruger, Stantz, Kiser. Proc. SPIE 2002. RF/NIR heating thermal expansion pressure waves US signal ???
Measured Data S+ upper hemisphere inadmissable transducer • Integrate fover spheres • Centers of spheres on sphere • Partial data only for mammography S- lower hemisphere
r-filtered inversion (complete data) • Backproject data (thanks to V. Palamodov!) • Switch order of integration • Use d-manifold identity (4x!) • f Riesz potential • f after high-pass filter imaging object Use co-area formula
r-filtered FBP Inversion Formulae (complete data)
FBP w/experimentalweighting Numerical Results (G Ambartsoumian)256x256 images from (Nf,Nq,Nr) = (400,200,200) FBP with 1/r weighting
machine precision, as it should be FBP r-filtered Simulated data sans noise (Nf,Nq,Nr) = (800,400,512)
full scan data w/o noise (Nf,Nq,Nr) = (800,400,512) sabs = 0.002 sabs = 0.004 sabs = 0.006 Low Contrast Detectability
r-filtered with ½ data in f Partial Scan Reconstructions (Nf,Nq,Nr) = (400,200,200) FBP with ½ data inq
even wrt r Consistency Conditions –Necessary, but maybe not sufficient
poly of degree k in p!! Consistency Conditions –Implications measure ck on S-; evaluate ck on S+
deg 24 deg 16 RTCTf(3/8,r) deg 8 r Polynomial Expansion Accuracy f=1 f=0 High-order expansions required!!!
P2 deg 8 Evaluate for p3 [0, 1)i.e.,q3[1,3) deg 16 Polynomial Extrapolation – Stability f=1 f=0 Measure over p3[-1,0) • rescale so q3[-1,1) • fit measurements to another set of Leg. polys deg 24 P2
extrapolated data measured data
½ scan only ½ scan+deg-10 extrap additive white noise s = 0.01
½ scan reconstruction – zero-filling vs. data extension with respect to z-only window width = 0.6 full scan data w/o noise (Nf,Nq,Nr) = (800,400,512) window width = 0.3 window width = 0.2 window width = 0.3
window width = 1.2 ½ scan FBP reconstruction – 0.2% “absolute” additive white noise zero-filling vs.data extension deg 12 deg 16 deg 4 window width = 1.3 window width = 0.6 window width = 0.6 window width = 0.6 deg 8
Dx= 1 Dx= 2 Dx= 4 Dx= 6 Attenuation Blurs DISCLAIMER - WIP PNT Wells, Biomedical Ultrasonics • soundspeed c=1500m/s • where • t ~ t are dual Fourier variables • b ~ 1 • a ~ 0.1 MHz-1 cm-1
Attenuation-Partial Scan Heuristic Image Quality Impact DISCLAIMER - WIP use 2D xray transform & exploit projection-slice Ideal Object/Full Scan Attenuation-Full Scan
GOAL : biannual screening TCT for small low-contrast masses xrays miss. Xrays for precursors (microcalcs) non-Math Conclusions • Positives • cheap ?? • non-ionizing • high-res (exploits hyperbolic physics) • 2x depth penetration of ultrasound, sans speckle • detect masses • Issues • will not detect microcalcifications • contrast mechanism not understood • fundamental physics (attenuation, etc) and HW constraints will impact IQ
GOAL #1 Incorporate fundamental physics GOAL #2 incorporate hardware constraints Math Conclusions • FBP type inversion formulae • Partial scan - unstable outside of “audible zone” • Palamodov • Davison & Grunbaum • Anastasio et al , Xu et al – OK inside • Attenuation – expect blurring • cos qtransducer response – Finch
Simulated data sans noise (Nf,Nq,Nr) = (800,400,512) r-filtered FBP
½ scan reconstruction – 0.2% “absolute” noise zero-filling vs.data extension window width = 0.8 window width = 0.8
projection-slice theorem Recover image edges tangent to measurement surface edges w/resolution comparable to that of surface parameter s measure Wave Fronts in 2-D Standard Radon so
f=1 “direct” information about horizontal edges; “indirect” information about vertical edges. Wave Fronts in TCT
supp f Spherical Transforms • 2D • Circles centered on lines • Circles through a point Xray CT – line integrals • 2D • 3D • Grangeat • line plane • plane recon’d image • Katsevich line recon’d image • 3D • Spheres centered on plane • Spheres through a point supp f Recon Background
Recon Background Spherical Transforms • 2D Circles centered on circles (Norton) • 2D • Circles centered on lines • Circles through a point • 3D • Spheres centered on sphere(Norton & Linzer, approximate inversion for complete data) • 3D • Spheres centered on plane • Spheres through a point