Download
1 / 51
510 likes | 744 Views
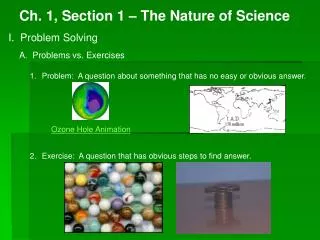
The Nature of Science Objective 1 . 1A. Demonstrate safe practices during field and laboratory testing Major things to remember Know equipment functions Goggles are ALWAYS safer than anything else on your eyes Always tell your teacher & follow his/her instructions about any situation.

E N D
1A • Demonstrate safe practices during field and laboratory testing • Major things to remember • Know equipment functions • Goggles are ALWAYS safer than anything else on your eyes • Always tell your teacher & follow his/her instructions about any situation
Acid into water is doing what you ought to! Small amount of acid to larger amount of water!
2A • Plan and implement investigative procedures including asking questions, formulating testable hypotheses, and selecting equipment and technology
Tools for Measurement A balance is used to measure mass. A graduated cylinder, dropper, or volumetric flask is used to measure volume. Beakers & regular flasks do NOT measure accurately A buret is the most accurate – a pipette/pipet is the next most accurate
Mass is in? Volume in? Length in? Grams Liters Meters Measuring Units
Which of the following will allow measurement of a liquid’s volume with the greatest precision? A 50 mL cylinder graduated in 1 mL increments B 50 mL cylinder graduated in 0.5 mL increments C 100 mL cylinder graduated in 1 mL increments D 200 mL cylinder graduated in 5 mL increments Smaller increments = greater accuracy & precision
Variables – remember - MIX Manipulated or Independent Variable is the one you are changing and is first in a data table and plotted on the X-axis of the graph.
Variables - DRY Dependent or Responding variable is the factor affected by the independent variable, and plotted on the Y-axis of a graph.
Look at the equipment & see what it can measure then determine your answer
A Control • Control or control group is one that participates in the experiment without the change being tested. (Receives a placebo, or grown under the same conditions.) Does NOT have a manipulated variable • You use it to compare the experimental group to so you can see if a change happened!
2B • Collect data and make measurement with precision
Data Collection and Sample Size The larger the amount of data collected, The larger the sample size, The more times the experiment is repeated, The more valid are the results. MORE is better!
The illustration shows volume levels of a liquid in a graduated cylinder before and after a sample was removed. According to this information, what was the volume of the sample to the nearest milliliter? In other words: How much volume did the sample take up?
Four lab groups measured the volume of acid required to neutralize a standard solution of sodium hydroxide base. Which of the groups measured the volume with the highest precision? REMEMBER: What piece of equipment measures with the greatest precision?
2C • Organize, analyze, evaluate, make inferences and predict trends from data • Only use data provided
Reading Tables and Graphs • When a question includes a table or graph, read it first, before the question. • Don’t just Look at it READ IT. • What is the Title, what is being measured or compared? What units (grams, mLs, minutes, years) are given? • Are the numbers or slope increasing, decreasing? • After reading the data, now read the question!
Reading Graphs Always read the title. Read the x- & y-axis labels & UNITS. What is happening? As the pressure of oxygen increases, the % saturation is increased.
Graph Types – Pie and Bar Pie Graphs are used to show parts of a whole and percent distributions. Bar Graphs show noncontinuous data / comparisons such as number of males and females in each science class with different hair colors.
Graphs – Line or Curves Line Graphs show continuous data like distance vs. time, acceleration, or plant growth over 6 weeks
Which graph best shows the comparison of the elements to the total composition of the copper ore? Which type of graph is best for showing percentages?
Use your periodic table!!! A stable element will have # of electrons = to # of protons = atomic # According to the periodic table and the information above, which element has this electron configuration? F Sodium G Neon H Magnesium J Argon
2D • Communicate valid conclusions • Conclusions must be based ONLY on the information provided in the paragraph, chart, or graph that you are provided • Read the question carefully – sometimes it will only apply to part of the info given • Look at the labels on the graph or chart
More dense = sink More buoyant = float In a question about density, bouyancy will most likely be in the answer and vice versa! Three liquids were poured into a beaker and formed three layers. Which conclusion is best supported by the information above?A The mass of Liquid 2 is greater than the mass of Liquid 3. B The volume of Liquid 1 is less than the volume of Liquid 3. C The density of Liquid 3 is greater than the density of Liquid 2. D The buoyancy of Liquid 2 is greater than the buoyancy of Liquid 1.
Boiling water can be used to sanitize dishes. The data above show how sanitizing time varies in different locations. Which inference is supported by these data? F The boiling point of water is constant at higher altitudes. G The boiling point of water is affected by elevation. H Water takes longer to boil at Fort Davis than at sea level. J Boiling water changes temperature at a faster rate at Corpus Christi than at higher elevations.
3A • Analyze, review, and critique scientific explanation, including hypotheses and theories, as to their strengths and weaknesses using scientific evidence and information • AGAIN: Only base your answer on the info provided in the question
3B • Draw inferences based on data related to promotional materials for products & services • Look carefully at the info provided and make sure it matches up with your answer
Horses kept in stables sometimes chew on wood. This can lead to damage to the mouth and digestive system. The graph shows the results of a study of a medication that prevents horses from chewing on wood. From the graph, what inference can be made about the effectiveness of the product? A Most horses like the medication. B The medication is most effective between Days 4 and 5. C Most horses will show improvement within 7 days. D The effects of the medication are long lasting.
Many doctors recommend 800 µg of folate, 400 µg of vitamin B12, and 50 mg of vitamin B6 per day to improve cardiovascular health. Based on this information and the nutrition label, the cardiovascular health benefit of a 1-ounce serving of this cereal is— A doubtful because it provides insufficient folate and vitamin B6 and lacks vitamin B12 B superb because it contains only 22 g of carbohydrates and 75mg of sodium C excellent because it provides all needed vitamins and is low in fat and cholesterol D poor because it raises blood cholesterol levels with its high fat and cholesterol content
Now you try!! Answer the questions in the order they appear on your review paper.
The label shown above contains information about some harmful effects of acetone. A group of students plans to use acetone to rinse out a glass container. A second group of students is working at the same lab table. Which of the following lab procedures should the second group of students avoid? A Heating water with an open flame B Pouring hydrochloric acid into a beaker C Filtering precipitates from a liquid solution D Collecting oxygen from plants in a test tube Check the features of the chemical and see what major safety precautions should be taken
READ CAREFULLY! The question is “What do you do to TEST the hypothesis?”
The picture above shows a compound microscope. What part of the microscope should be used to adjust the amount of light illuminating a prepared slide? A Eyepiece B Rotating nosepiece C Diaphragm D Coarse-focus knob
Which statement says what they were trying to prove or disprove?
The table shows four mass readings of one object as measured by four different balances. Which balance produced the most-consistent measurements?
This diagram shows the biochemical pathway that produces arginine in Neurospora, a mold. Neurospora is easily grown on a simple jelly-like medium. Different substances can be added to the medium. A mutant Neurospora lacking Enzyme Y would have to have which of these added to its medium in order to survive?