Download
1 / 38
380 likes | 482 Views
Summary of Implementation and Findings for the Green Diamond NSO HCP Since 1992. Program Status of Surveys Demographic/Density Studies Data Available Summary of Trends. Signed September 1992 30-year plan with a 10-year major review (amended 2007). Major Provisions of HCP.

E N D
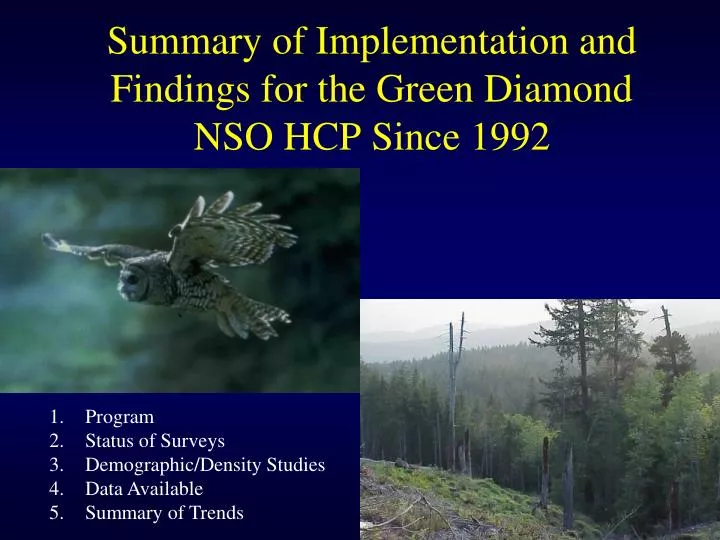
Summary of Implementation and Findings for the Green Diamond NSO HCP Since 1992 Program Status of Surveys Demographic/Density Studies Data Available Summary of Trends
Signed September 1992 30-year plan with a 10-year major review (amended 2007)
Major Provisions of HCP • Conservation strategy: • Grow owl habitat • Additional measures: • Set asides • 39 areas, 13,200 acres (no harvest) • Special management area • 36,500 acres, no owl “take” • No direct harm to nesting owls • Research and monitoring • Incidental take permit (58 takes over 30 years)
Studies and Monitoring Dusky-footed woodrat On-going surveys since 1989 and demography study since 1990 Numerous studies on prey base Largest NSO dataset in existence: 1,824 captures, >4,000 total captures/recaptures Sonoma tree vole
Key NSO Findings Residual older structure is important for roosting and nesting
Food Habits Woodrats are the primary prey and their density is highest in young forest stands Density (# rats / ha) Stand age class Hamm 1995
Telemetry study including night vision work,1998-2000 hunting perches
Development of “Foraging” and Nesting Resource Selection Models • “Foraging” model based on telemetry data from 24 owls (1998-2000) • Nesting model based on nests from 1990-2001 • Successful nest (173) with >75% coverage in GIS • Foraging RS model applicable
Analysis of ‘Habitat Fitness’ • NTA (“Foraging”) model based on telemetry data • Nesting model based on successful nests from 1990-2001 • Survival analysis • Mark-resight data of 835 individuals from 1990-03 • Fecundity analysis • 467 nests from 1990-2001
Landscape habitat characteristics within 0.71 km radius circles. Dark areas are NSO habitat; white areas are other vegetation types. (From Franklin et al., 2000)
Culmination of Ten-Year Review Analysis of Habitat Quality • The very best habitat will increase by 83% over the life of the Plan • By 2060, a total of 87% of the ownership is projected to be in the two highest categories of habitat quality • Roosting and nesting habitat (stable core area) in close proximity to young forests (woodrat habitat) is the key
Drivers of future habitat quality: Riparian reserves that will create more older forests adjacent to young forests Non-Fish bearing Non-Fish bearing (2,531 miles) Fish bearing
Projections of Habitat Fitness (Best) • Future landscapes: • 1st decade based on harvest forecast • Next 40 years based on spatially explicit harvest schedule model
Projections of Habitat Fitness • Future landscapes: • 1st 10 years based on planned harvest schedule • Next 40 years based on spatially explicit harvest schedule model
Projections of Habitat Fitness • Future landscapes: • 1st 10 years based on planned harvest schedule • Next 40 years based on spatially explicit harvest schedule model
Projections of Habitat Fitness • Future landscapes: • 1st 10 years based on planned harvest schedule • Next 40 years based on spatially explicit harvest schedule model
Projections of Habitat Fitness • Future landscapes: • 1st 10 years based on planned harvest schedule • Next 40 years based on spatially explicit harvest schedule model
Projections of Habitat Fitness • Future landscapes: • 1st 10 years based on planned harvest schedule • Next 40 years based on spatially explicit harvest schedule model
Percent Ownership in Different Projected Habitat Lambda Values by Decade
Trends in Apparent Survival From: Forsman et al. In press. “Demographic Trends of Northern Spotted Owls: A Meta-analysis, 1985-2008.
Trends in Fecundity From: Forsman et al. In press. “Demographic Trends of Northern Spotted Owls: A Meta-analysis, 1985-2008.
Realized Rate of Population Change From: Forsman et al. In press. “Demographic Trends of Northern Spotted Owls: A Meta-analysis, 1985-2008.
Response of NSO to Habitat Modification (Displacement) • Timber harvesting activities may directly harm or kill owls – not documented in 20+ years • Some habitat modification may indirectly harm owls through changes in behavior that results in a reduction in site occupancy, survival or reproduction – form of take documented under HCP
Reporting and assessment of take occurred when habitat triggers exceeded Direct – harvest within 500’ of owl site • Indirect – harvesting within 0.5 mile radius such that: • <89 acres >45 years old • or • <233 acres >30 years old
Biological Verification of Take • Assess three years following timber harvest that triggered a take: • Owls nest in 2 years • Continuous occupancy and nesting in 1 year • Assess for a maximum of five years following timber harvest
Analysis of Biological Impacts of Take • Used top models from 2008 NSO meta-analysis (Forsman et al. 2011) to analyze impacts of take on survival and fecundity • Conclusions: • Take as documented in HCP had no measureable affect on mean annual survival • Take did affect reproduction with a mean annual reduction of 2.8% in the number of young produced
Enter a New Threat Northern Spotted Owl (Strix occidentalis caurina) Northern Barred Owl (Strix varia varia)
Barred Owl Removal Experiment Response variables: NSO occupancy, survival and fecundity • Beginning in 2009, barred owls removed (treatment) from half of Green Diamonds spotted owl study area • Allowed to colonize and increase in the other half (control)
Trend in occupied NSO sites on adjacent treatment and control areas 11 BOs removed from 6 territories 8 BOs removed from 5 territories 16 BOs removed from 9 territories “Reference year”
Sullivan Mad River NSO Sites Nursery Lower Quarry 4107 Occupied in 2009 4230#1 New in 2010 or = nested 4128 Boundary 4230 #2 Scale = 0.5 miles 4076 4910 Blue Blossom 5700 Lower Dry Lower Simpson 6007 Devils Creek Dry Cr 6000 CF
Tentative Conclusions from Removal Case Studies • At least some resident NSOs apparently remain near their historical activity center for years following displacement by BOs • High and often rapid re-colonization by both original resident and new NSOs suggests BOs tend to displace NSOs from high quality sites (i.e., BOs are taking sites that are in “high demand” by NSOs)
Model averaged estimates of detection probabilities with 95% confidence limits derived from Green Diamond’s THP data. Estimates were generated for May 7 of each year.
Rob Nagel Photography Rob Nagel Photography
Pacific fisher Forest HCP Covered Species Northern Spotted Owl Courtesy Nick Nichols Red and Sonoma tree voles Courtesy Nick Nichols
Conservation Program Biological Goals Retain and Recruit Habitat Elements Promote Habitat Mosaic Compliance, Validation, Monitoring, Adaptation Protection of Covered Species Barred Owl Research