Download
1 / 32
370 likes | 550 Views
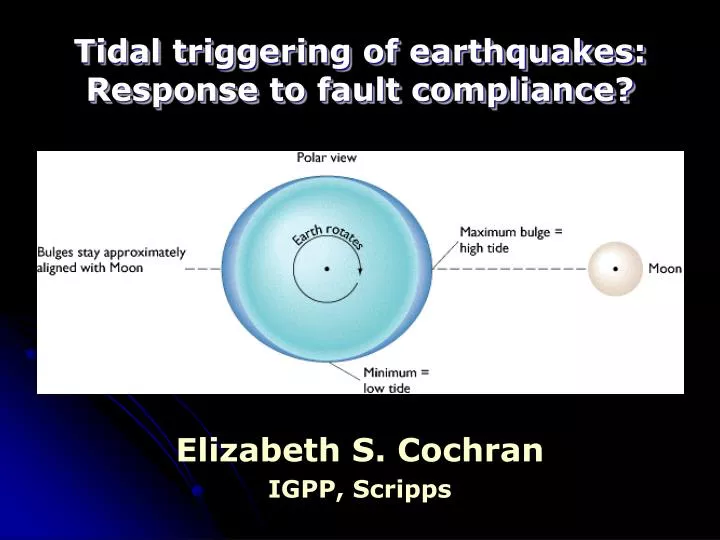
Tidal triggering of earthquakes: Response to fault compliance?. Elizabeth S. Cochran IGPP, Scripps. Acknowledgements. Tidal triggering Sachiko Tanaka John Vidale Compliant faults Yuri Fialko Peter Shearer YongGang Li John Vidale. Tides and Faults.

E N D
Tidal triggering of earthquakes: Response to fault compliance? Elizabeth S. Cochran IGPP, Scripps
Acknowledgements • Tidal triggering • Sachiko Tanaka • John Vidale • Compliant faults • Yuri Fialko • Peter Shearer • YongGang Li • John Vidale
Tides and Faults • We determine what amplitude of stress loading is necessary to trigger an earthquake • Tells us how sensitive faults are to stress changes. • Given an applied stress load we can estimate how much more likely an earthquake is assuming a known background rate. • We study the physical response of faults in the field to applied stresses and the underlying mechanics Folds back in the question of: How are faults different from unbroken crust?
Why tidal triggering? Correlation of seismicity with Earth tides has long been expected: • Earthquakes are triggered by stress changes from nearby earthquakes, water level changes in dams, etc. • Laboratory friction experiments that use oscillatory stress input show an increase in events near the time of peak stress Evidence of tidal triggering has so far been sparse, but there have been some recent hints: • Tanaka et al., 2002, 2004 correlate seismicity with tides in Japan and other regions preceding large events. • Tolstoy et al., 2002 correlate ocean tides with harmonic tremor and microearthquakes along the Juan de Fuca ridge
Breathing of the seafloor: Tidal correlations of seismicity at Axial volcano [Tolstoy et al., 2002] Microearthquakes and harmonic tremor recorded in 1994 at Axial volcano along the Juan de Fuca ridge found to correlate with ocean levels Peak at 2 cycles/day Spectrum of harmonic tremor
Global and local studies of tidal correlation [Tanaka et al., 2002, 2004] • Found hints of a correlation with Earth tides of seismicity on reverse and normal faults • Looked at correlation only as a function of tidal phase, not amplitude • Used shear stress or J1 (trace of stress tensor) component of stress only, not Coulomb stress
Tidal Stress Calculation • Calculations by Sachiko Tanaka • Both solid Earth and ocean loading • Elastic loading in PREM from model of sea surface topography • Calibrated with sea surface level observed with satellites • Stress can get very large near the coast due to ocean loading • Solid Earth tide: 0.005 MPa • Ocean loading: 0.05 MPa Ocean model JAO.99b
Dataset • Global Earthquakes CMT catalog • Mw 5.5 or larger, since 1977 9,000+ reverse, strike-slip, normal and oblique events
Tidal Phase and Amplitude • For each event we calculate: • Tidal phase (q) and stress amplitude at the earthquake origin time • Coulomb stress calculated for m = 0 (shear only), 0.2, 0.4, 0.6, 0.8, ∞ (normal only) tc = ss + msn • Failure is encouraged when normal stress is decreased on the fault and shear stress is increased in the direction of slip – Need to know the fault plane!
Tidal Stress Oscillations:when are tidal stresses large? Peak After Average =t p Earthquake q = 45o Peak Before 0
Range of Peak Tidal Stress Amplitudes (tp) Earthquakes should be more easily triggered when the peak tidal stresses are high, so we order the events from highest to lowest average peak tidal stress (tp) High stress to Low Stress tp(1) tp(2)
Fault Plane Ambiguity We can only identify the true fault plane on which to calculate the Coulomb stress for thrust fault earthquakes where the shallow-dipping plane agrees with local strike and dip of subduction We analyze 2027 shallow, thrust earthquakes
Mechanisms of 19 shallow thrust events at the time of largest peak stress (tp)
Two Statistical Tests • Schuster’s Test Requires independent datasets and tests for non-random distribution of the data across tidal phase • Binomial Test Simple test assuming random distribution of events across tidal phase.
Schuster’s Test • Determine whether the distribution of observed tidal phases is non-random, however the majority of events do not have to be near 0o phase. • We calculate the vector sum over the phase angles: • P-value gives a measure of random (near 1) or non-random (near 0) distribution:
Binomial Test We distribute the events into two equal phase range bins: Bin 1: Tidal phase encouraging stress (-90 < q > 90) Bin 2: Tidal phase discouraging stress Null: If events occur at random (not influenced by the tides) there should be equal probability of an earthquake being in Bin 1 or Bin 2. However, if there are more events in Bin 1 (encouraging tidal stress) than Bin 2, we can compute the probability of having a certain number of extra/excess events Encouraging Phase (-90o to 90o) Discouraging Phase (-180o to -90o & 90o to 180o)
5% level Lowest probability (0.0027%)
Best Correlation (255 events, m=0.4):Binomial Probability=0.0027% (99.997% would not see by chance); P-value=0.0076% (99.992% not a random distribution)Sinusoidal fit to the data gives a peak ~ 0o phase. So, not only are there more events during the encouraging stress phase, but the number peaks near 0o phase! 255 Earthquakes with largest tp
Revisiting the 255 most correlated earthquakes… 161 out of 255 events are in Bin 1 (-90o < q > 90o) Nex = 33.5 Nex(%) = 13% 161 / 255 = 63%
Group events by tp We subdivide the events into four bins based on tp: Bin A: tp > 0.02 MPa [19 eqs] Bin B: 0.01 < tp > 0.02 MPa [41 eqs] Bin C: 0.004 < tp > 0.01 MPa [155 eqs] Bin D: tp < 0.004 [1813 eqs] The statistical significance on these bins is not as good as that of the entire dataset, but we attempt to see if a larger number of events are triggered when tidal stresses are highest
Strong Tides Trigger More Earthquakes Global Thrust California Strike-Slip 27,464 California Strike-Slip Events (Parkfield and Calaveras) Significant Triggering
How does this compare to other studies of non-tidally triggered earthquakes? Hardebeck et al., 1998; Stein, 1999; and others Aftershocks are triggered when coseismic stress changes are a few tenths of a bar (~0.01 MPa) Aftershocks triggered by Landers rupture [Stein, 1999]
Do our results fit experimental rock physics observations? Several laboratory experiments have been conducted to estimate the triggering of events given a imposed stress load. We examine the predictions of: (1) Rate- and State- Dependent Friction (2) Stress Corrosion
Rate and State Friction The rate of loading and the state of the fault effect when a fault will rupture. Rate and state friction predicts an increase in seismicity rate given an increase in the stress load. R/ro: Actual / Background Rate Dt: Load Increase sn: Normal Stress (~10 MPa) A ~ Fault Viscosity Lab: 0.003-0.006 Our: 0.003 (Kanamori & Brodsky, 2004; Beeler and Lockner, 2003; Dieterich, 1994)
Stress Corrosion Prior to rupture, acceleration of strain is due to subcritical crack growth in a material. Stress corrosion predicts weakening with increased load. R/ro: Actual / Background Rate Dt: Load Increase s: Stress Drop (~2 – 10 MPa) n ~ Material Property Lab: 5 – 20 Our: 16 (Kanamori & Brodsky, 2004; Main, 1999)
Least squares fit of data to rate- and state- friction (A = 0.003) and stress corrosion (n=16) Global Thrust California Strike-Slip
Tidal Data vs. Experimental Results The data fit to both rate- and state- friction and stress corrosion suggest that faults are more responsive to small stress changes than predicted by laboratory theory.
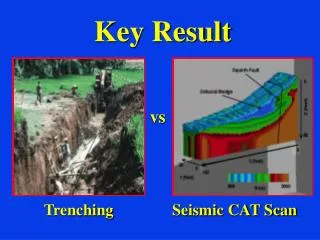
Detailing Fault Response Tidal triggering levels suggest faults are highly responsive to relatively weak stress loads. Faults are loci of strain? We need to study the structure of faults and their response to stress loading in greater detail. After Fialko et al., 2002
Fault ≠ Plane Fault zone trapped wave studies show that faults are not simple shear planes, but are zones of damaged rock with reduced strength. From Li et al., 2003
Faults are zones of damaged rock resulting from repeated rupture: • Influences fault rupture properties • Localizes strain • Changes the distribution and propagation of fluid flow in the crust After Chester et al., 2003
Further Questions • Are all earthquakes types as responsive to tidal stresses? • Regional studies suggest normal faults are also highly responsive, but no global studies have been done. • Strike-slip earthquakes studied in California showed low levels of triggering by tides. • Are earthquake depth and magnitude important? • Are tidal stresses similar across the entire rupture plane of a large magnitude earthquake? • Do details of the coastline affect how responsive a fault is to the large ocean tides? • What fault properties result in the highly responsive nature of faults?


![The signs of the times(2) [earthquakes]](https://cdn1.slideserve.com/2296340/the-signs-of-the-times-2-earthquakes-dt.jpg)