Download
1 / 26
260 likes | 530 Views
PETROBRAS. On-Line Control of Oil Derivates Production in a Refinery. 2002 Osisoft Users Conference Monterey - CA Antonio Carlos Gomes de Souza. The Company. The Refinery. On Line Control of Oil Derivates in a Refinery. Benefits. PETROBRAS in the World. DOWNSTREAM. Downstream.

E N D
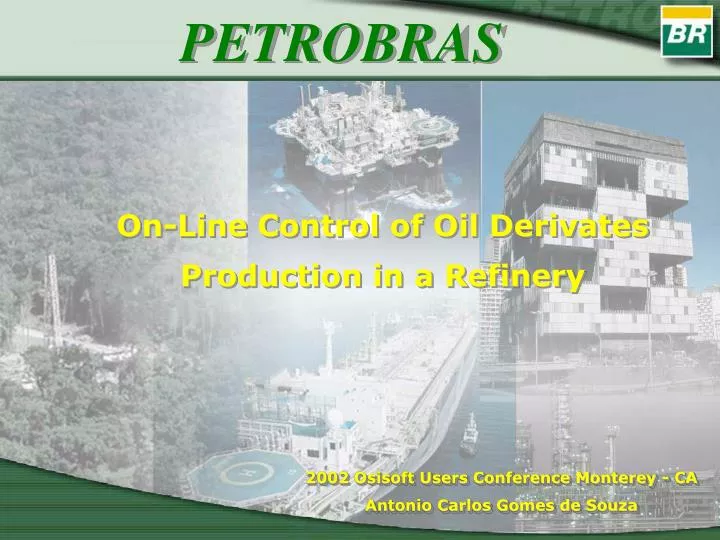
PETROBRAS On-Line Control of Oil Derivates Production in a Refinery 2002 Osisoft Users Conference Monterey - CA Antonio Carlos Gomes de Souza
The Company The Refinery On Line Control of Oil Derivates in a Refinery Benefits
Downstream Marketing & Commercialization Wholesale & Retail Refining Logistics Petrochemicals Organization
Net Income 17,720 14,203 12,719 6,326 5,185 5,085 2,542 US$ million 2,238 1,902 1,862 1,570 0 4,000 8,000 12,000 16,000 Source: PFC, Companies Report Earnings 2000 - An Outstanding Year
Leadership in Refining Worldwide Refining Capacities Petrobras controls 11 refineries in Brazil with a capacity about 2 million barrels per day Petrobras controls 2 refineries in Bolivia and 1 Argentina. Petrobras is the 5th biggest refiner among international companies Petrobras refined 92% of the company’s sales in 2000 1.000 2.000 3.000 4.000 5.000 6.000 mbpd Source: PFC
Petrobras will invest US$ 29.4 billion (2001-2005) Capital Expenditures (US$ billion) Corporate (2%) Gas & Power (7%) International (18%) Downstream (28%) Domestic (82%) UPSTREAM (63%) Business The Company Refineries Region
1994 vs. 1999, CAGR (oil and gas) Source: Merrill Lynch (company reports and estimates) Number 1 in Production Growth
Petrobras’ World Records COMPLETION AND PRODUCTION AT 1,877m EXPLORATORY WELL AT 2,777m Deep Waters – 1.877m Roncador Field in Basin Campos
Petrobras Refineries Location Capacity Paulinia Mataripe Duque de Caxias São José dos Campos Araucária Canoas Cubatão Belo Horizonte Capuava Manaus Fortaleza Cochabamba Santa Cruz de La Sierra Baia Blanca 352.000 306.000 242.000 226.000 189.000 189.000 170.000 151.000 53.000 46.000 6.000 3.000 6.000 5.000 bpd Source : Petrobras
PETROBRAS LANDULPHO ALVES REFINERY PETROBRAS LANDULPHO ALVES REFINERY R L A M-MATARIPE Aerial View
RLAM – Products “36 FINISHED PRODUCTS”
Basic Diagram of Plant Information SCMD GENERATION ENERGY DATA PROCESS UNIT C-22000 SIMULATOR PETROX PROCESS UNIT CORROSION ON-LINE EXPERT SYSTEM DATA PUMPS MANITORING 231 BOMBAS DATA TO PI DATA TO PI DATA TO PI C-22004 PI-HOME 1000 PUMPS ALL THE REFINERY DATA TO PI NEW PI-HOME UNDER WINDOWS 2000 SERVER BDO TWO NEWS SERVERS Lab Results Network PI REDE ETHERNET PI TAGS C-22008 PI-NET Advanced Control POINTS BY ACG - 8.000 Process Book Users OPERATIONAL SYSTEM -VMS ACG-1 COMUNICATION WITH THE DCS ACG-2 COMUNICATION WITH THE DCS Remote Access ACG-3 COMUNICATION WITH THE DCS DCS Network - ENET ICS FCS INTERFACE YOKOGAWA - CENTAP - 1.0.8 OPERATIONAL SYSTEM - UNIX PROCESS UNIT
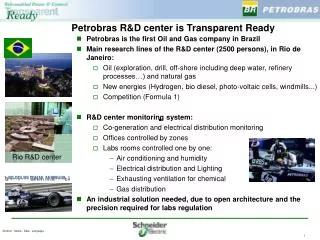
Plant Information Monitoring Pump Monitoring Process Optimization On-line Corrosion Units Production X Storage The Future Energy Balance Feed, Steam and Energy Units Optimization
Calculation Expected x Actual Process Information Optimization Process Optimization Process U-32 Naphta E 22,6% R 16,3% 0,0% 217 ºC 272 ºC 6040 E 6,1% Kerosene R 4,8% 148 ºC OIL 379 ºC E 13,0% D. Light R 15,9% E 10,7% D. heavy 4 ºC R 8,9% 0,0% % oxygen E 2,0% 4,8% -733 GOL R 1,5% E 47,5% The balance of this plant is closing in 102% E 21,1% R 54,2% GOP R 12,1% Control Range - 102% e 98% E 2,2% GOR 8,5% R 1,7% 360 ºC -0,1% E 22,1% RV R 41,5%
Boiler Situation Feed Trend GV-5101 GV-5102 GV-5103 GV-5104 GV-5105 GV-8301 B-631 GV-3901 8/2/2002 13:59:00 74 8/2/2002 14:05:30 85 8/2/2002 14:03:00 72 8/2/2002 14:01:00 0 8/2/2002 14:07:30 87 8/2/2002 14:06:30 87 8/2/2002 14:04:40 81 8/2/2002 14:07:38 304 TOTALIZE 8/2/2002 14:07:38 Feed - Steam - Energy UNITS STEAM Plants Situation Feed current / schedule Trends U-32 U-9 U-7 U-7A U-8 U-6 U-30 U-11 U-12 U-13 U-18 U-23 U-24 U-25 U-39 8/2/2002 14:04:45 21534 / 27000 8/2/2002 14:05:15 9173 / 9000 8/2/2002 14:04:02 1 / 0 8/2/2002 14:01:32 222/ 350 8/2/2002 14:07:32 1100 / 500 8/2/2002 14:07:10 3998 / 5000 8/2/2002 14:05:38 799 / 1300 8/2/2002 14:00:02 4 / 600 8/2/2002 14:06:15 549 / 650 8/2/2002 14: 07:32 199 / 570 8/2/2002 14:04:15 1404 / 1550 8/2/2002 14:04:02 63 / 500 8/2/2002 14:03:02 260 / 300 8/2/2002 14:04:32 160 / 200 8/2/2002 14:07:08 11032 / 10000 ENERGY Situation Boiler MW 8/2/2002 14:06:00 18 8/2/2002 13:59:40 0 8/2/2002 13:59:40 0 8/2/2002 14:05:30 6 8/2/2002 14:03:00 17 8/2/2002 14:05:22 0 S-65 L-17D93A L-17D93C TG-5101 TG-8301 TG-3901 0-60% 90-100% 60-90% TOTALIZE MW 8/2/2002 14:04:00 23
Expert System Diagram in the Process Plant Experts System Plant Instruments and Probes Labs Results Knowledge Base Calculation Module INTERFACE DCS NET DCS Inference Engine Expert Interface Data Access Inference Output
Expert System Application to Gas Treatment Corrosion Control GAS TREATMENT PLANT
Expert System Application to Gas Treatment Corrosion Control HIGH PRESSURE Diagnose warning Alarm High operation temperatures High rich and lean amine loading Ratio of CO2 to H2S in the acid gas Amine solution contaminants and degradation Amine solution concentration Severe oxygen contamination control Heat stable salts in the solution Wastewater drag from FCC Ratio of CO2 to H2S in the acid gas
Pump Monitoring Discharge Pressure Discharge Flow Discharge Pressure Discharge Flow Discharge Flow Discharge Pressure
Benefits • Improve Profitability • Plant Stabilization • Increase Quality Products • Reduce Energy Cost • Increase Utilization Factor
The Future INFRARED