Download
1 / 6
70 likes | 282 Views
Collecting and Displaying Data Graphing Unit. Graphs. **All Graphs Must Have a Title!!! **A graph must have a KEY when it displays more than 1 type of data so that you know what is being compared . Displaying Data.

E N D
Graphs • **All Graphs Must Have a Title!!! • **A graph must have a KEY when it displays more than 1 type of data so that you know what is being compared.
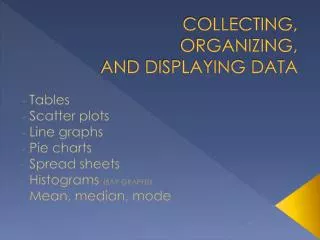
Displaying Data • Line Plot: shows responses to a survey by marking X’s on a line above the choice • Frequency Table: shows responses to a survey as a number in a table • Tally Marks: shows responses to a survey by making tally marks beside each choice ( llll )
Displaying Data Continued • Double Bar Graph: a graph that compares 2 sets of data. Double Bar Graphs must have a key to tell you what data is being compared. • Line Graphs: often used to show changes over time and make comparisons • Pictographs: a graph that shows number information by using picture symbols. Pictographs need to have a key to tell you what numerical value each picture represents. • gggggggggggggggggggggggggggggggggggggggggggggggggggggggggg
Graphing Ordered Pairs • Ordered Pairs (Graphing on a Coordinate Grid): a pair of numbers often used to locate a point in a plane. • X-Axis: the horizontal axis • Y-Axis: the vertical axis • Origin: on a coordinate plane, it is the name for the ordered pair (0,0)
Range, Median, Mode, and Mean • Range: Maximum number minus the minimum number • Median: After listing your numbers in order, this is the middle number in a set of data • Mode: This is the number that shows up the most in a set of data (it helps to list your numbers in order) • Mean: The “average” of a set of data