Download
1 / 25
250 likes | 261 Views
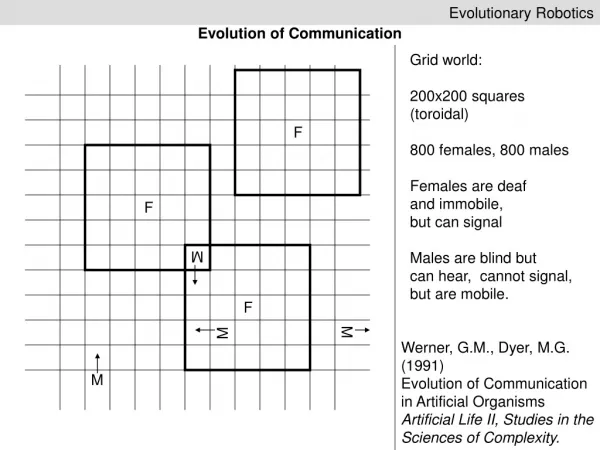
Evolvability Analysis for Evolutionary Robotics. Sung-Bae Cho Yonsei University, Korea. Agenda. Motivation Analysis framework of evolution Adaptive evolution Adaptive behaviors Evolutionary pathways Evolution of fuzzy logic controller Simulation results Summary. Motivation.

E N D
Evolvability Analysis for Evolutionary Robotics Sung-Bae Cho Yonsei University, Korea 1
Agenda • Motivation • Analysis framework of evolution • Adaptive evolution • Adaptive behaviors • Evolutionary pathways • Evolution of fuzzy logic controller • Simulation results • Summary 2
Motivation Evolutionary Phenomena Desirable Evolution Chances Innovative functional structures Increased complexity Necessity Random genetic drift Adaptivity 3
Can the same results be obtained? Adaptive evolution ( ) What properties are genetically preferred? Adaptive behaviors ( ) How the solutions are formed? Evolutionary pathways to the solutions ( ) Behavioral properties? Emergence ( ) Motivation Evolutionary Routes 1 2 3 4 4 3 1 2 4
Analysis Framework Role of Analysis Components Application of the analysis framework to a real-world problem • Adaptive evolution • Does the evolving system maintains a good level of evolvability, especially in a real-world problem? • Adaptive behavior • What properties make certain components more adaptive? • Evolutionary pathways • How the solutions have evolved, i.e., evolutionary pathways? 6
Analysis Framework Definitions of Evolvability • The capacity to produce good solutions via evolution • Genome’s ability to produce adaptive variants when acted on by the genetic system (Wagner and Altenberg, 1996) • Capacity to generate heritable phenotypic variation (Kirshner and Gerhart, 1998) • Capacity to create new adaptations, and especially new kinds of adaptations, through the evolutionary process (Bedau and Packard, 1992) 7
Analysis Framework Evolvability Measures • Evolvability as the rate of complexity increase • By Chrystopher L. Nehaniv • maxcpx gives the largest complexity of any entity at time t • The complexity of an entity is the least number of hierarchically organized computing levels needed to construct an automata model of a target system • Krohn-Rhodes algebraic automata theory and finite semigroup theory • Evolutionary activity statistics • By Mark A. Bedau 8
Analysis Framework Evolutionary Activity Statistics (1) • Evolutionary activity • A counter, , of the ith component at time t • Updated as the component persists • Inherited with reproduction • Initialized when the component changes, e.g. mutation • Update function should be chosen carefully according to the problems at hand 9
Analysis Framework Evolutionary Activity Statistics (2) • Mean activity: • D(t) is the number of component I at time t with ai(t)>0 • Represents continual adaptive success of components • New activity: • is the number of components I with ai(t)>0 • Represents adaptive innovations flowing into the system 10
Analysis Framework Evolutionary Activity Statistics (3) • Need to measure evolvability in two models • Target model • Shadow model • To screen off non adaptive evolutionary forces 11
Analysis Framework Schema Analysis • Definition (Holland, 1968) • A similarity template that designates a set of chromosomes having same alleles at certain loci • Consists of a set of characters and don’t-cares • Example • Character set = {0,1}, don’t care=# • #0000 {10000, 00000} • #111# {01110, 01111, 11110, 11111} • Adaptive schema = the size of the set that this schema describes increases 12
Analysis Framework Observational Emergence • Emergence • “creation of new properties” – Morgan, C.L., Emergent Evolution, Williams and Norgate, 1923 • Observational emergence • Proposed by N.A. Bass, 1992 • S : structure (system, organization, organism, machine, …) • P : property observed by observational mechanism, Obs 13
Evolution of Fuzzy Logic Controller Fuzzy Logic Controller for Mobile Robot 14
Evolution of Fuzzy Logic Controller FLC Parameters for Khepera Robot • Input variables : 8 proximity sensors of Khepera mobile robot • Output variables : 2 motors of Khepera mobile robot • Linguistic values of fuzzy sets • Membership function of fuzzy sets 15
Evolution of Fuzzy Logic Controller Gene Encoding of FLC Gene representation for an individual • 8 proximity sensors • 2 motors Decoding of a rule Encoding of a membership function of a variable 16
Simulation Results Experimental Setup • Population size : 50 • Maximum generation : 1000 • Overlapped population by 50% with elitism • Crossover rate : 0.5 • Mutation rate : 0.01 • Evolutionary activity • Measuring evolvability in two models • Target model • Neutral shadow : no selective pressure • To screen off non adaptive evolutionary forces 17
Simulation Results Adaptive Evolution Evolutionary activity Mean activity New activity 18
Simulation Results Adaptive Behavior Salient Rules 19 With SR2 With SR8 Without SR2 Without SR8 With SR10 Without SR10
Simulation Results: Evolutionary Pathways Schema Analysis Salient Rules Best Individual 20
Simulation Results: Evolutionary Pathways Rule B2 and B7 Activities of instances of schemata S{1}, S{4}, and B{2} Activities of instances of schemata S{6} and B{7} S{6} B{7} S{1} S{4}B{2} 21
Simulation Results: Observational Emergence Parameters of Emergence 22
Simulation Results: Observational Emergence Turning Around Int First-order structures Three Obs1s of first-order structures A Obs2 of a second-order structure S2 • The property observed by Obs2 of S2 constructed through the interactions of three first-order structures is quite different from the properties observed by Obs1( ), • By the definition of observational emergence • Turning around behavior (Obs2(S2))is observationally emergent 23
Simulation Results: Observational Emergence Smooth Cornering Int First-order structures Two Obs1s of the first-order structures A Obs2 of a second-order structure S2 • The property observed by Obs2 of S2 constructed through the interactions of the two first-order structures is quite different from the properties observed by Obs1( ), • By the definition of observational emergence • Smooth cornering behavior (Obs2(S2)) is observationally emergent 24
Summary • Application of evolvability measure to a real-world problem • Illustration of evolutionary pathways to the best individual • The evolvability measure shows that the performance of the best individual is the results of its rules’ adaptability • Schema analysis shows that most of the rules of the best individual are the combination of the rules of earlier stage of evolution 25