Download

1 / 22
220 likes | 339 Views
Chapter Nineteen MULTIVARIATE ANALYSIS: An Overview. Two Types of Multivariate Techniques. Dependency dependent (criterion) variables and independent (predictor) variables are present Interdependency variables are interrelated without designating some dependent and others independent.

E N D
Two Types of Multivariate Techniques • Dependency • dependent (criterion) variables and independent (predictor) variables are present • Interdependency • variables are interrelated without designating some dependent and others independent
Dependency Techniques • Multiple regression • Discriminant analysis • Multivariate analysis of variance (MANOVA) • Linear structural relationships (LISREL) • Conjoint analysis
Multiple Regression • Extension of bivariate linear regression to include more than one independent variable. • Y = βo + β1 X1 + β2 X2 + β3X3 + …..+ ε • Use of multiple regression • Predict values for a criterion variable (dependent variable) by developing a self-weighting estimating equation.
Multiple Regression • Control for confounding variables to better evaluate the contribution of other variables • Test and explain causal theories • Path analysis • Method of least squares (minimizing the sum of squared error terms) are used as in bivariate regression • Coefficients (B) vs. standardized coefficients (beta weights)
Multiple Regression • Estimation Method • Enter method • includes all the variables in the order of variables entered. • Forward selection • starts with the constant and adds variables that results in the largest R2. • Backward selection • include all the variables and remove variable that change R2 the least.
Multiple Regression • Stepwise selection • The variable with the greatest explanatory power is added first. Subsequent variables are included according to their marginal (or incremental) contribution. • A variable entered can be removed later if it becomes insignificant at a given alpha. • This method which combines both forward and backward methods is the most popular method.
Multiple Regression • Tests • T- test for individual coefficients • Ho : βi = 0, d.f. for t : n-k-1 • F-test for the overall model • Ho : R2 = 0 d.f. for F : (k, n-k-1) • As R2 increases, standard error (of the estimate) decreases. The smaller standard error, the better model.
Multiple Regression • Collinearity (or Multicollinearity) problem • What is it? • Situation where two or more independent variables are highly correlated. • What is consequence? • Unreliable regression coefficients • How to detect? • High correlation coefficients among independent variables (r >.8 requires attention)
Multiple Regression • Collinearity problem continued • Collinearity statistics (VIF): • If VIF>10, then multicollinearity suspicion • How to fix? • Choose one and delete another when two independent variables are highly correlated. • Create a new variable that is a composite of the two.
Multiple Regression • Autocorrelation problem • Commonly found in time series data • What is it?: Error terms are correlated • What is consequence?: Unreliable coefficients • How to detect?: Visual detection, DW statistics • How to fix? • Taking the first difference • Taking logarithm • Lagged dependent variable as an additional independent variable
Multiple Regression • Use of dummy variables • Dummy variables are used when a nominal scale variable is to be included in the regression • When there are two categories of the variable, then one dummy variable is used. • When there are n categories, then n-1 dummy variables are used.
Discriminant Analysis • Use • Classify persons or objects into various groups. • Analyze known groups to determine the relative influence of specific factors (or variables) • Model • Similar to the multiple regression • Dependent variable: nominal • One equation for two groups, two equations for three groups, and so on. • Independent variables: interval or ratio
MANOVA • Assess relationship between two or more dependent variables and classificatory variables (or factors). • Examples: measuring differences between • employees • customers • manufactured items • production parts
Uses of LISREL • Explains causality among constructs not directly measured • Two parts • Measurement model • Structural Equation model
Conjoint Analysis • Mainly used for market research and product development. • Evaluate a set of attributes to choose the product that best meets their needs
Interdependency Techniques • Factor analysis: techniques to reduce many independent variables into a few manageable number. • Cluster analysis: a set of techniques for grouping similar objects or people • Multidimensional Scaling (MDS): a special description of a participant’s perception about a product, service, or other object of interest
Factor Analysis • Computational techniques that reduce variables to a manageable number of factors that are not correlated with each other. • Principal components analysis is most popular:construction of new set of variables (which are called “factors”) based on relationships in the correlation matrix.
Factor Analysiscontinued • Loading and communalities(h2) • Loading: correlation between a variable and a factor • Communalities: variance in each variable explained by all the factors • Eigenvalue • A measure of explanatory power of each factor • Eignevalue/# of variables: % of total variance explained by each factor
Factor Analysiscontinued • Rotation • To make pure constructs of each factor by focusing on a few major determinants of each factor. • To improve representations of variables by factors and to differentiate between factors. • Methods: Orthogonal vs. oblique
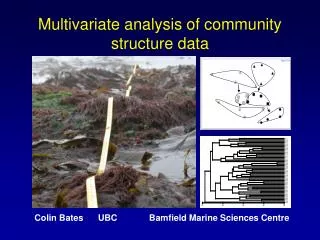
Steps in Cluster Analysis • Select sample to be clustered • Define measurement variables (e.g. market segment characteristics) • Compute similarities among the entities through correlation, Euclidean distances, and other techniques • Select mutually exclusive clusters • Compare and validate the clusters
Multidimensional Scaling • a special description of a participant’s perception about a product, service, or other object of interest • Used in conjunction with cluster analysis or conjoint analysis. • Used to understand difficult-to-measure constructs