Download
1 / 16
180 likes | 317 Views
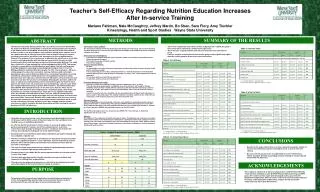
CHKS Summary Results. Sonora Elementary School District 2018-2019 Data Collection. What does the CHKS measure?. The CHKS is a comprehensive, youth risk behavior and resilience data collection service available to all California local education agencies.

E N D
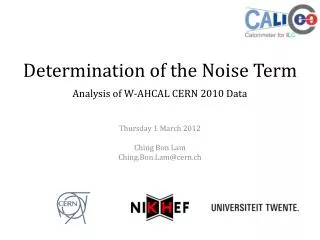
CHKS Summary Results Sonora Elementary School District 2018-2019 Data Collection
What does the CHKS measure? • The CHKS is a comprehensive, youth risk behavior and resilience data collection service available to all California local education agencies. • It measures the following in grades 5 & 7: • alcohol, tobacco, and other drug use • school safety, harassment, and violence • nutrition and physical health • sexual behavior and attitudes (secondary school only – but not administered) • suicide and gang involvement (secondary school only) • youth resilience and developmental supports • School-connectedness, truancy, and self-reported grades
Sample Size • Grade 5 SES: 50 • Grade 5 County 238 • Grade 7 SES: 82 91% • Grade 7 County 375 73% 57% 42%
Summary of Key Indicators% of respondents reporting “Yes, Most or all of the time.” School Engagement and Supports
Summary of Key Indicators% of respondents reporting they have experienced the following. School Safety
Summary of Key Indicators% of respondents reporting lifetime usage. Substance Use
Summary of Key Indicators% of respondents reporting usage within the past 30 days. Substance Use
Summary of Key Indicators% of respondents reporting usage in the past 30 days. Substance Use
Summary of Key Indicators% of respondents reporting lifetime usage. Substance Use
Summary of Key Indicators% of respondents reporting “Strongly Agree or Very Much True” Mental and Physical Health
Next Steps • While this survey represents a sample (57-73%) and may not accurately reflect the entire population, it does reveal trends about those who took the survey. • Less than 70% could compromise validity.
Concern: Experienced Chronic Sadness or Hopelessness in the past 12 months California results are from Biennial Statewide Report 2015-2017 grades 7-11. California results are from CHKS, Elementary Main Report, 2015-2017 for grade 5.
Concern: Seriously Considered Suicide in the past 12 months California results are from Biennial Statewide Report 2015-2017 grades 7-11. California results are from CHKS, Elementary Main Report, 2015-2017 for grade 5.
Concern: Experienced Cyberbullying California results are from Biennial Statewide Report 2015-2017 grades 7-11. California results are from CHKS, Elementary Main Report, 2015-2017 for grade 5.
Concern: E-cigarette Use California results are from Biennial Statewide Report 2015-2017 grades 7-11. California results are from CHKS, Elementary Main Report, 2015-2017 for grade 5.
Concern: Marijuana Use California results are from Biennial Statewide Report 2015-2017 grades 7-11. California results are from CHKS, Elementary Main Report, 2015-2017 for grade 5.