Download
1 / 38
400 likes | 586 Views
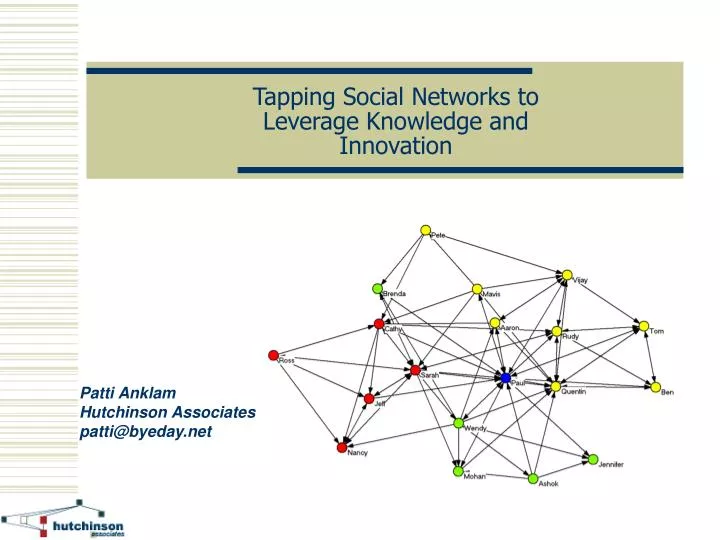
Tapping Social Networks to Leverage Knowledge and Innovation. Patti Anklam Hutchinson Associates patti@byeday.net. Acknowledgment . Work with Social Network Analysis at Nortel was bootstrapped through participation in research with the Institute for Knowledge-Enabled Organizations (IKO)*

E N D
Tapping Social Networks to Leverage Knowledge and Innovation Patti Anklam Hutchinson Associates patti@byeday.net
Acknowledgment • Work with Social Network Analysis at Nortel was bootstrapped through participation in research with the Institute for Knowledge-Enabled Organizations (IKO)* • Rob Cross and Andrew Parker, researchers, provided “above and beyond” support for key projects as well as solo projects during my learning process. *Formerly Institute for Knowledge Management (IKM) ©2003 Patti Anklam
Human Structural Customer Context: Knowledge Management is about Leveraging Capital • “Social capital consists of • the stock of active connections among people; • the mutual understanding, trust, and • shared values and behaviors • that bind the members of human networks and communities and make cooperative action possible.” Don Cohen & Laurence PrusakIn Good Company Social ©2003 Patti Anklam
The Science of Networks • Multi-disciplinary research and applications • Physics • Cell biology • Internet and WWW • Economics and social sciences • Epidemiology • Homeland security • Supported by mathematical evidence that networks of all types exhibit similar properties and architecture ©2003 Patti Anklam
Metabolic Network ©2003 Patti Anklam Source: Albert Laszlo Barabasi
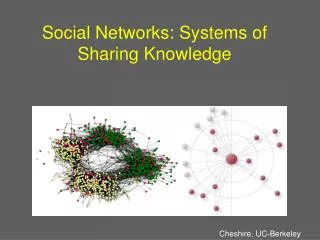
A Social Network ©2003 Patti Anklam
The Al Qaeda Network ©2003 Patti Anklam http://www.orgnet.com/MappingTerroristNetworks.pdf
The Premise of Social Network Analysis for Knowledge Management • Successful organizations understand the need to ensure that knowledge and learning are reaching all the parts of the organization that need them. • Knowledge flows along existing pathways in organizations. • To understand the knowledge flow, find out what the patterns are. • Create interventions to create, reinforce, or change the patterns to improve the knowledge flow. ©2003 Patti Anklam
Business objectives for doing an analysis • Increased innovation, productivity, and responsiveness through plugging “know-who” gaps • Smarter decisions about organizational changes and establishment of key knowledge roles • Insight into challenges of knowledge transfer and integration following restructuring, mergers, or acquisitions ©2003 Patti Anklam
The Methodology • Interview managers and key staff to understand the specific business problems or opportunities • Identify the network • Survey the individuals in the network to determine existing connections among them • Use computer modeling tools to depict the network • Identify opportunities for improvement or potential problems (interviews and workshop) • Design and implement interventions to change the network • Follow up ©2003 Patti Anklam
Data Collection and Survey Methods • Qualitative • Survey members of existing social networks to diagnose problems and identify opportunities • Quantitative: • Transaction analysis (emails, phone calls) • Analysis of information artifacts (email, documents, search strings) to identify similarity of interests ©2003 Patti Anklam
Qualitative Survey ©2003 Patti Anklam
Survey Questions • SNA for knowledge management questions: • Frequency of knowledge exchange • Value of interactions • Knowledge of each other’s knowledge and skills • SNA for organizational development: • Decision-making paths • Trust • Energy Development of the questions and delivery of the survey must be sensitive and appropriate to the current context of the organization ©2003 Patti Anklam
Function = Product Line A = Operations = Small Accounts = Product Line B = Product Line C = HR/Finance = Large Accounts = President View of a Network I frequently or very frequently receive information from this person that I need to do my job. ©2003 Patti Anklam
Function = Product Line A = Operations = Small Accounts = Product Line B = Product Line C = Large Accounts Removing Managers, Administrators, and HR I frequently or very frequently receive information from this person that I need to do my job. ©2003 Patti Anklam
Quantitative Analysis Provides Management Insight Density. Data provides the percentage of information-getting relationships that exist out of the possible number that could exist. It is not a goal to have 100%, but to target the junctures where improved collaboration could have a business benefit. Frequently or very frequently receive ©2003 Patti Anklam
Junctures in Information Flow Target Opportunities for KM Density. Data provides the percentage of information-getting relationships that exist out of the possible number that could exist. It is not a goal to have 100%, but to target the junctures where improved collaboration could have a business benefit. ©2003 Patti Anklam
Combining Question Results People want to communicate more with those who they already receive information from. Communicate More Information ©2003 Patti Anklam
= KM Team = Portfolio = Technology Innovation Group I frequently or very frequently receive information from this person that I need to do my job. ©2003 Patti Anklam
Innovation Group – Who Knows Who? I frequently or very frequently receive information from this person that I need to do my job. Separated by “do not know this person.” Everybody knows these people, or knows who they are Colors represent geographical locations ©2003 Patti Anklam
Concepts Represented by Mathematics • Distance: degrees of separation (also referred to as the diameter of a network) • Ties/Degree: in-degree and out-degree represent the number of connections, or ties, to and from a person • Centrality: the extent to which a network is organized around one or more central people • Density: the percentage of connections that exist out of the total possible that could exist ©2003 Patti Anklam
Comparative Metrics Provide Benchmarks ©2003 Patti Anklam
Using the Results of SNA Categories of Interventions • Organizational • Leadership work • Restructuring and process redesign • Staffing and role development • Knowledge Management • Tools and technologies (expertise locators, discussion forums, and so on) • Collaborative knowledge exchange and getting acquainted sessions • Individual action • Personal and public • Personal and private ©2003 Patti Anklam
Addressing Concerns • Social Network Analysis practitioners are committed to use SNA in ethical ways, sensitive to individuals. • Interviews are used to validate results with managers before displaying to wide audiences • Results are presented in context ©2003 Patti Anklam
Learning from Research ©2003 Patti Anklam
Common Patterns Identified • Clusters: dense subgroups • Connectors: individuals who link to many people in an informal network (in some cases, bottlenecks) • Boundary spanner: individuals who connect networks to other parts of an organization • Information broker: connects clusters within an informal network • Outliers: people less well connected, may be termed “peripheral specialist” Adapted from “The People Who Make Organizations Go or Stop”Rob Cross and Laurence Prusak Harvard Business Review, June 2002 ©2003 Patti Anklam
Some Principles from the Science • The structure of networks is not random • Six degrees of separation are but one proof point • Small worlds abound • Ties may be weak or strong • Strength is a factor of frequency and proximity • Weak ties are often more useful than strong ties • The rich get richer • Nodes with many links tend toget more links • Structural holes represent opportunities ©2003 Patti Anklam
Tie Strength and Community Memberships • Social networks and communities: • People who have more ties join more groups • The more ties people have to others in the same group, the longer they stay in the group • The more ties people have to others outside of the group, the less time they stay in the group • Strong ties to many people in the same group increase the duration of membership longer than weak ties • Weak ties to nonmembers increase the rate of joining new groups McPherson et al, “Social Networks and Organizational Dynamics”, 1995 ©2003 Patti Anklam
Let’s Look at Some More Examples ©2003 Patti Anklam
Group = KM = Process = Technology = Manager Knowledge Problem? I am likely or highly likely to be more effective if I could communicate more with this person. ©2003 Patti Anklam
HR Group = Asia Pacific = Europe = Americas = Manager Communication Problem? I frequently or very frequently receive information from this person that I need to do my job. ©2003 Patti Anklam
Quality Problem? Frequently Get Information Need to Communicate More ©2003 Patti Anklam
Summary ©2003 Patti Anklam
Why Do an Analysis? • Six Myths about Informal Networks*: • To build better networks, we have to communicate more • Everybody should be connected to everybody else • We can’t do much to aid informal networks • How people fit in is a matter of personality (which can’t be changed) • Central people who have become bottlenecks should make themselves more accessible • I already know what is going on in my network *Rob Cross, Nitin Nohria, and Andrew Parker, MIT Sloan Management Review, Spring 2002 ©2003 Patti Anklam
SNA Moves People to Action • Provides concrete view of flows and relationships: • Makes concrete how work is happening in comparison to the formal structure. • Makes visible the aspects of a group that we can work with. • Qualitative and Quantitative aspects: • Graphics are very meaningful to people. • Data enable metrics, provide meaningful information when there are very large numbers of people • The combination “cracks the code” of delivering this type of diagnostic data to managers • Proven uses in: • Planning for reorganization (or post-reorganization) • Identifying key people prior to mergers or acquisitions • Succession planning and retention • Knowledge creation and sharing • Improving organizational effectiveness ©2003 Patti Anklam
SNA Applications • Target knowledge management programs based on opportunities identified in junctures • Identify and reward individuals for “invisible” work • Identify key individuals for retention • As part of team kick-off for cross-functional or cross-organizational projects • To identify lead users for change management programs ©2003 Patti Anklam
Technologies for Identifying and Creating Social Networks • Categories of software • Discovery Systems – Verity, Lotus, Autonomy • Expertise Location – Tacit, Kamoon • Technologies • Natural language processing techniques used in indexing content detect similarity of concepts in an increasingly sophisticated way • Visualization tools aid in navigation of hierarchies and clusters of documents • Recommender systems suggest documents and people to contact based on a worker’s current task ©2003 Patti Anklam
More Information • SNA Reading List: • http://patti.byeday.net/sna/ • email: patti@byeday.net ©2003 Patti Anklam