Download
1 / 40
400 likes | 487 Views
Covertness Centrality in Networks. Michael Ovelg önne UMIACS University of Maryland mov@umiacs.umd.edu. Chanhyun Kang, Anshul Sawant Computer Science Dept. University of Maryland {chanhyun, asawant}@cs.umd.edu. VS Subrahmanian UMIACS & Computer Science Dept. University of Maryland

E N D
Covertness Centrality in Networks Michael Ovelgönne UMIACS University of Maryland mov@umiacs.umd.edu Chanhyun Kang, Anshul Sawant Computer Science Dept. University of Maryland {chanhyun, asawant}@cs.umd.edu VS Subrahmanian UMIACS & Computer Science Dept. University of Maryland vs@cs.umd.edu
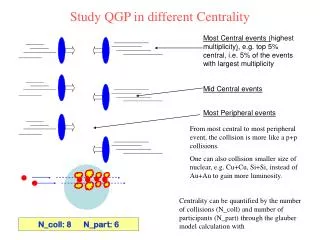
Motivation Let’s assume there is a criminal network and we want to find a leader of this group using the henchmen. Who is thegang leader of this network? Henchmen We may want to use centrality measures to identify important criminals in the network
Motivation Betweenness centrality We can think of the vertex of a suspicious person as the leader in this network Closeness centrality But, if the leader is smart and understand(or know) the measures?
Motivation If the leader is sufficiently smart, he may - Hide in a crowd of similar actors - Have enough connections with the henchmen The gang leader would be not like this vertex The gang leader would be like these vertices
Motivation • Typically, if we plot centrality values and % of nodes in graph G, the distribution obeys a power law and has a long tail (closeness centrality is an exception). • A vertex that wants to stay “hidden” does not want to stick out in the long tail. • It would prefer to be squarely near the “high percentage” part of the distribution. But in order to communicate with the their own subnetworkwith lower probability of discovery, they need to be more to the right Nodes that want to stay “unnoticed” don’t want to be in this part of the distribution. To stay “unnoticed”, nodes want to stay here % of nodes centrality value 0
Motivation But a smart leader may know various centrality measures, so we need to consider a set C of centrality measures to identify the smart leader Closeness centrality Betweenness centrality Degree centrality Eigenvector centrality
In this paper • Propose covertness centrality measure. Has two major components: • How “common” a vertex is with regard to a set C of centrality measures • How well the vertex can “communicate” with a user-specified set I of vertices • Develop algorithms to compute covertness centrality • Exact and heuristic algorithms • Evaluate the measures and the algorithms
Commonness • Measures how well an actor a hides in a crowd of similar actors • CM(C, a) denotes the commonness of an actor a from the given centrality measures C=(C1, C2, …, Ck) Closeness centrality Betweenness centrality C, a CM The common-ness value of actor a Eigenvector centrality Degree centrality
Commonness • Instead of giving specific commonness functions, we first identify axioms that all commonness measures should satisfy • Axioms for Commonness • Property 1. Optimal Hiding. If all vertices have the same centrality according to all measures, then all vertices should have commonness of 1. • Property 2. No Hiding. If the centrality of v is sufficiently different from the centrality of all other vertices according to all centrality measures, then v’s commonness is 0. • Property 3. If the values of a centrality measure for all vertices are the same, then the commonness values for all vertices should be the same after removing the centrality measure ( ) ( ) ( ) ) ( ( ) ) (
Commonness • We suggest two measures to compute CM(C, a) • CM1(C, a) • Compute similar actors of actor a for each centrality measure separately • CM2(C, a) • Compute similar actors of actor a with all centrality measures simultaneously CM1(C, a) CM2(C, a) =
Commonness : Similar actors • We consider actors similar to actor aw.r.t. one centrality measure Ci • The probability that a randomly chosen actor excluding the actor a has a centrality Ci value within the interval Iiis Actors similar to actor a for centrality Ci - α : the range of similar values Interval Ii - σi : standard deviation of Ci values a Ci centrality values Ci(a) - ασi Ci(a) Ci(a) + ασi High → ← Low
Commonness: CM1 • Define commonness as the sum of the squared distances separately for each centrality k : the number of centrality measures in C CM1(C, a) - We compute the probability for each centrality measure - Why not simple summation of the probabilities? Because even if the summations of the probabilities are same, the commonness value of actor A should be larger than the other’s value if the deviation of probabilities of actor A is smaller than the other’s deviation.
Commonness: CM1 • Satisfies Property 1. Optimal Hiding • If the centrality values of all actors are same, the number of the similar actors is |V|-1. So the commonness values of all vertices is 1. • Satisfies Property 2. No Hiding • If the centrality values of all actors are not similar to each other, the number of similar actors is0. So the commonness value of all vertices is 0. • Does not satisfy Property 3 - Let’s assume C={C1,C2} , the number of similar actors of actor v for C1 is r and the number of similar actors of actor v for C2 is |V|
Commonness: CM1 We compute the CM1 values using Betweenness, Closeness, Degree and Eigenvector centrality measures for the criminal network. - α=1 We can find some suspicious people who hide in a crowd. But it is not clear. There is a problem.
Commonness: CM1 • If the centrality measures are very different, measuring the similar actors independently for each centrality measure can lead to problems. The vertices will have good commonness values even if the number of similar actors for C2 is small % of node C2 centrality C1 centrality Normalized centrality value The vertices will have good commonness values even if the number of similar actors for C1is small
Commonness : Similar actors • We can also consider actors similar to a given actor ausing all given centrality measures C simultaneously. - σi , σj: standard deviations of Ci values and Cjvalues Cj centrality values - α : the range of similar values High ↑ Similar actors of actor a Interval Ii Cj(a) + ασj a Interval Ij Cj(a) Cj(a) - ασj Ci centrality values Ci(a) - ασi Ci(a) Ci(a) + ασi High →
Commonness: CM2 • Define commonness as the fraction of all actors that are similar to actor ain all considered dimensions CM2(C, a)= - The centrality values of similar actorsare within all intervals generated from all centrality values of actor a - We compute the probability that a randomly chosen actor excluding the actor a has centrality values within all the intervals from all the centrality values ofa
Commonness: CM2 • Even if the centrality measures are not correlated, the vertices will have small commonness values % of node a b C2 centrality C1 centrality Normalized centrality value
Commonness: CM2 • Satisfies Property 1. Optimal Hiding • If the centrality values of all actors are the same, the number of similar actors is |V|-1. So the commonness values of all vertices are 1. • Satisfies Property 2. No Hiding • If the centrality values of all actors are not similar to each other, the number of similar actors is0. So the commonness values of all vertices are 0. • Satisfies Property 3 • Let’s assume C={C1,C2} , the interval of actor v for C1 isI1and the values of C2for all vertices are the same • The intervals of all vertices for C2are same • So the number of similar actors for C1 and the number of similar actors for C1 and C2 are the same
Commonness: CM2 We compute the CM2 values using Betweenness, Closeness, Degree and Eigenvector centrality measures for the criminal network. - α=1 Now we can find clearly some suspicious people who hide in a crowd
Communication Potential The gang leader has enough connections to communicate with the henchmen for achieving their objective G A subgraph of Gusing the henchmen For measuring the communication ability precisely, we need to use a subgraph, induced by some vertices, of the criminal network
Communication Potential • Reflect the ability of vertex v to communicate with vertices in set I. • : if only in-group connections are important for achieving the group’s objective • Define the communication potential based on a centrality measure D and the group V’ • Let G’=(V’, E’) be induced subgraph of G given by V’ • : if the ability to communicate with people outside the group is important as well, the entire graph G is used
Communication Potential We compute CP1 values using Closeness centrality We can find some people who have good communication ability in the subgraph that contains the henchmen G CP1 A subgraph of Gusing the henchmen
Communication Potential We compute CP1 values using Betweenness centrality Some people have better communication ability in the subgraph that contains the henchmen than others CP1 A subgraph of Gusing the henchmen
Communication Potential We compute CP2 values using Closeness centrality We can find some people who have good communication ability in the network G CP2
Covertness Centrality • Covertness centrality is a combination of Commonness and Communication potential • Let’s assume CP is normalized to the interval [0,1] like CM • lmeasures the importance of Commonnessvs. importance of Communication Potential • τis a minimum level of commonness set by the user • if CM < τ, CP is irrelevant to CC • If τ=0, CC is a classic trade-off between the CM and the CP
Covertness Centrality We compute CC values (λ=0.5 and τ=0) using CM2(α=1) and CP1(Closeness centrality) Who is thegang leader of this network? CC The guy is the most suspicious person who leader who - Hides in a crowd of similar actors - Has enough connections to communicate with others including the henchmen
Covertness Centrality CC values(τ=0) varying the l (CM2(α=1) and CP2(Closeness centrality)) L 0.2 l=0.5 l=0.2 The CC values of vertices that have a high CM value are increased according to the increase of l l=0.8 The CC values of vertices that have a high CP value are decreased according to the increase of l
CC COMPUTATION • Exact computation • Simple random sampling method • The sample vertices are randomly chosen • Systematic sampling method • Order all vertices by degree. Then, select k vertices by taking every n/k-th vertex starting from a start vertex randomly selected among the first n/k-th vertices A start vertex n/k-thvertex n/k-thvertex Low degree High degree … The first n/k-th vertices
Experimental Evaluation • We analyze the properties of the covertness centrality and the algorithms • Dataset • Python is used for CM1 and CM2 implementation • Evaluated on a standard desktop machine
Evaluation : Measures • Scatter plot of the commonness scores according to CM1 and CM2 in relation to closeness centrality • Degree, Closeness, Betweenness and Eigenvector centralities • URV dataset • CM1 values are high because of other centrality values
Evaluation : Measures • Distribution of CC scores depend on different λ values • CM2: Degree, Betweenness, Closeness and Eigenvector centrality • CP : closeness centrality • URV dataset - Commonness is strongly negatively correlated to the base centrality measures
Evaluation : Measures • Distribution of CC scores depend on different λ values • CM2: Degree, Betweenness, Closeness and Eigenvector centrality • CP : closeness centrality • URV dataset - Covertness centrality is similar to the CP values when l is small
Evaluation : Compute time & Accuracy • The runtime scales linearly with the number of vertices if the centrality values are already computed. • Comparison of the rank correlation between the exact algorithm and the sampling algorithms for the URV dataset. Very high correlation!
Evaluation : Accuracy • Accuracy of sampling methods measured with Kendall’s τrank correlation coefficient. Very high correlation! -CM1, 100 runs for the simple sampling method -CM2, 100 runs for the simple sampling method -Systematic sampling method is better than the simple sampling method
Conclusion • Defined a new concept of covertness centrality combining • Commonness • Measures how well an actor hides in a crowd of similar actors w.r.t. a given set of centrality measures • Proposed axioms that any good commonness function should satisfy. • Proposed two new commonness measures CM1 and CM2 and showed that CM2 satisfies all the axioms. • Communication Potential • Measures the ability to communicate and cooperate to achieve a common objective • Used sampling methods for computing the covertness centrality • Evaluated the measure and the sampling methods on YouTube and email (URV) data.
Related works • R. Lindelauf, P. Born, and H. Hamers, “The influence of secrecy on the communication structure of covert networks,” Social Networks, vol. 31, no. 2, pp. 126-137, 2009 • Deal with the optimal communication structure of terrorist organizations when considering the tradeoff between secrecy and operational efficiency • Determine the optimal communication structure which a covert network should adopt • J. Baumes, M. Goldberg, M. Magdon-Ismail, and W. Wallace, “Discovering Hidden Groups in Communication Networks” in Intelligence and Security Informatics, 2004, vol.3073, pp. 378-389 • Suggest models and efficient algorithms for detecting groups which attempt to hide their functionality – hidden groups • Use the property that hidden groups’ communications are not random because those are planed and coordinated
Commonness: CM1 • Define commonness as the sum of the squared distances separately for each centrality The probability for each centrality measure Why not the simple summation of the probabilities? Because even if the summations of the probabilities are same, - The commonness value of actor A should be larger than the other’s value if the deviation of probabilities of actor A is smaller than the other’s deviation.
Commonness: CM2 • Define commonness as the fraction of all actors that are similar to actor vin all considered dimensions - The similar actors’ centrality values are within the intervals generated from all centrality values of actor v