Download
1 / 26
260 likes | 352 Views
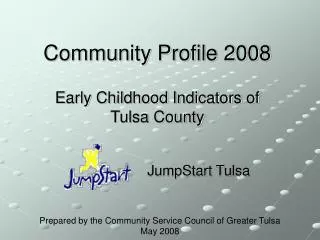
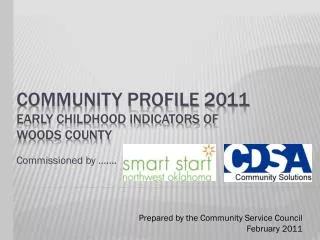
This PowerPoint was developed by ECMap to be used as a framework by coalitions and communities in presenting their community profile results. Understanding your community early development profile. Compiled by the Early Child Development Mapping Project (ECMap). June 2014. The report.

E N D
This PowerPoint was developed by ECMap to be used as a framework by coalitions and communities in presenting their community profile results.
Understandingyour community early development profile Compiled by the EarlyChild Development Mapping Project (ECMap) June 2014
The report profiles Alberta’s100‘early childhood development’ (ECD) communities
Edmonton Calgary ECD communitiesin Alberta
Why focus on the early years? • 0 to 5 most critical for development • Lay the foundation for everything that follows • Impact lifelong healthlearning, behaviourand well-being
Children grow up in an environment of relationships Families play a primary role.
Importance of communities • safe, walkable • well-designed playgrounds, recreational facilities and green spaces • quality, accessible child care and early learning opportunities • access to affordable, • nutritious food • supportive social • networks • welcoming & inclusive
Impact of society • comprehensive, accessible health care, • good parental leave policies • family friendly employment standards • job training and adequate wages, so parents can look after their families • high quality early care • and learning standards • coordinated services • for young children • and families
Weighing the benefitsof positive development _ + • struggle in school • high school dropout • lower paying jobs • acute and chronic illnesses • commit crime • addictions • school success • better jobs • earn more • physically and mentally healthier • stable relationships • better parent • better coping skills
Why is it important to have data on how young children are doing? Understanding → Action
Putting together the data Community Maps and Reports Socio- Economic Status Community Resources EDI
The EDI • Population-based measure • Surveys how children are doing in communities and across Alberta • Not about individual children • Questionnaires filled out by kindergarten teachers
EDI: 5 areas of development Physical Health & Well-being Social Competence Emotional Maturity Language & Thinking Skills Communication Skills & General Knowledge
EDI categories Developing appropriately: most or all developmental skills appropriate by kindergarten; above the 25th percentile or top 75 per cent Experiencing difficulty: probable delays in some areas of development; between the 10th and 25th percentile Experiencing great difficulty: significant delays in development; below the 10th percentile or bottom10 per cent
EDI: 2009 to 2013 • gathered twice by 135 school authorities • approximately 1,100 schools involved • 86,564 questionnaires collected; 70,206 questionnaires usable • two rounds collected in each community and merged to form baseline results
Five areas of development June 2014 (Updated) 70,206 questionnaires Please note: Percentages may not always add up to exactly 100% due to rounding or missing data. Alberta EDI results (2009-2013), ECMap
Developing appropriately Alberta 46.4% Communities Alberta EDI data (2009-2013), ECMap 16.4% Highest community ALBERTA Lowest community in ALL FIVE areas of development
Alberta comparedto the rest of Canada Alberta Canada Alberta EDI results (2009-2013), ECMap Great difficulty in TWO or more areas of development Great difficulty in ONE or more areas of development
Socio-economic status • Studies show a strong link between SES and early childhood development. • SES measured using Stats Canada data. • ECMap research shows a connection between high SES and high EDI results and poor SES and poor EDI. • Wide disparity in SESamong communities andsubcommunities.
ECD community resources • include programs and services, informal supports and physical features • identified by coalitions • total: 23,600
Community resources and early development • How do they impact EDI results? • Can they compensate for low socio-economic status (SES)? • Is there a difference in the quantity and type of resources in communities with different SES? • Are there gaps in resources?
Community results Your community results can be inserted here. Go to ECMap website at www.ecmap.ca and pull PPT slides from Findings and Maps, Community Results.
Who needs to know? • Who are the people in our community that need to know this information? • Who are the people that we should talk to first? • What is the most effective way of reaching them? • What are the key messages that we want to communicate?
For further information:list your contactinformation Other information 2014