Download
1 / 25
250 likes | 523 Views
Correlation & Regression. Chapter 10. Section 10-1 Introduction Section 10-2 Scatter Plots Section 10-3 Correlation Section 10-4 Regression Section 10-5 Coefficient of Determination and Standard Error of the Estimate Section 10-7 Summary. Outline .

E N D
Correlation & Regression Chapter 10
Section 10-1 Introduction • Section 10-2 Scatter Plots • Section 10-3 Correlation • Section 10-4 Regression • Section 10-5 Coefficient of Determination and Standard Error of the Estimate • Section 10-7 Summary Outline
RECALL: Inferential Statistics is a branch of statistics that consists of generalizing from samples to populations, performing hypothesis testing, determining relationships among variables, and making predictions • Our focus in this chapter will involve determining whether a relationship between two or more numerical or quantitative variables exists Section 10-1 introduction
A businessperson may want to know whether the volume of sales for a given month is related to the amount of advertising the firm does that month. • Educators are interested in determining whether the number of hours a student studies is related to the student’s score on a particular exam • A zoologist may want to know whether the birth weight of a certain animal is related to its life span • Medical researchers are interested in such questions as • Is caffeine related to heart damage? • Is there a relationship between a person’s age and his/her blood pressure? Examples
Correlation Regression • A statistical method used to determine whether a relationship between two or more variables exists • A statistical method used to describe the nature of the relationship (i.e., the mathematical relationship) between variables. Introduction
Are two or more variables related? • If so, what is the strength of the relationship? • What type of relationship exists? • Linear or nonlinear? • What kind of prediction can be made from the relationship? And, how valuable is the prediction? Questions to answer
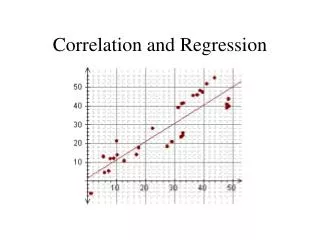
Are two or more variables related? AND If so, what is the strength of the relationship? • Visual Interpretation • Scatter plots • Consider overall pattern • Direction (slope) • Outliers (possible influential points) • Algebraic Interpretation • Correlation Coefficient • Numerical measure of the strength of the relationship between two quantitative variables How to answer the questions
What type of relationship exists? Two Types of Relationships • Simple • Has two variables (paired or bivariate data) • Independent variable, x • Dependent variable, y • Can be positive or negative • Positive—both variables increase or decrease at same time • Negative –one variable increases, as another variable decreases, or vice versa • Multiple • Two or more independent variables are used to predict one dependent variable How to answer the questions
What kind of predictions can be made from the relationship? • Predictions are within in the scope of the sample data only • Some predictions are more accurate than others, due to the strength of the relationship • The stronger the relationship is between variables, the more accurate the prediction is How to answer the questions
About Scatter Plots • First review section 2.5 regarding Paired Data and Scatter Plots (p. 86-88) • See questions 1-14 p. 88 Section 10-2 scatter plots
Independent Variable Dependent Variable • What we typically call “x” • Input variable • Variable that is controlled or manipulated • Plotted on Horizontal axis • What we typically call “y” • Output variable • Variable that CANNOT be controlled or manipulated • Plotted on Vertical axis (dependent variable) depends on (independent variable) Identify the variables
Scatterplots of Paired Data Figure 10-2
Scatterplots of Paired Data ley. Figure 10-2
Listed below are the weights (in pounds) and the highway fuel consumption (in mi/gal) of randomly selected cars. Is there a linear correlation between weight and highway fuel consumption? What does the result suggest about a national program to reduce the consumption of imported oil?
How to measure the strength of a linear relationship present in the scatter plot? • Calculate the linear correlation coefficient! Section 10-3 correlation
Aka Pearson product moment correlation coefficient (PPMC) • Named after Karl Pearson who pioneered the research in this area • Computed from the sample data measures the strength and direction of a LINEAR relationship between two variables • Symbol for the sample correlation coefficient is r • Symbol for the population correlation coefficient is r (Greek letter rho) • Range is from -1 to 1 inclusive Correlation coefficient
nrepresents the number of pairs of data present. denotes the addition of the items indicated. xdenotes the sum of all x-values. x2 indicates that each x-value should be squared and then those squares added. (x)2 indicates that the x-values should be added and the total then squared. xyindicates that each x-value should be first multiplied by its corresponding y-value. After obtaining all such products, find their sum. rrepresents linear correlation coefficient for a sample. represents linear correlation coefficient for a population. Notation for the Linear Correlation Coefficient
The linear correlation coefficient r measures the strength of a linear relationship between the paired values in a sample. Calculators can compute r. We will use MINITAB and EXCEL.
Round to three decimal places so that it can be compared to critical values in Table I, p. 642. Rounding the Linear Correlation Coefficient r
Use Table I on page 642 • a will be stated • Measure error level in the calculation • Degrees of Freedom, n – 2 • Designated by d.f. • The number of variables allowed before the calculation is determined (see. P. 358) • Compare the absolute value of r to the Table I value for given alpha value and the d.f. based on n Is the Correlation coefficient significant?
Listed below are the weights (in pounds) and the highway fuel consumption (in mi/gal) of randomly selected cars. Is there a linear correlation between weight and highway fuel consumption? What does the result suggest about a national program to reduce the consumption of imported oil?
Can we conclude that if two variables are related (correlation) that one variable causes the other variable? • Correlation does not imply causation • Let’s say that again:Correlation does not imply causation Causation & Correlation
If there is a strong linear correlation between two variables, then one of the following situations may be true about the relationship between the two variables: • There is a direct cause-and-effect relationship between the two variables. That is, x causes y • Heat causes ice to melt • There is a reverse cause-and-effect relationship between the two variables. That is, y causes x • A researcher believes excessive coffee consumption causes nervousness, BUT it may be that an extremely nervous person craves coffee to calm his nerves Causation & Correlation
The relationship may be caused by the interaction of several other variables • A researcher may find a significant relationship between students’ high school grades and college grades. But there are probably many other variables involved, such as IQ, hours of study, influence of parents, motivation, age, and instructors. • The apparent relationship may be strictly a coincidence • A researcher may find a significant relationship between the increase in the number of people who are exercising and the increase in the number of people who are committing crimes. But so-called common sense suggests that any relationship between these two values is coincidental. Causation & Correlation
The relationship may be caused by a third variable (lurking variable) • A statistician correlated the number of deaths due to drowning and the number of soft drinks consumed daily during the summer, but we can not say the soft drink is necessarily responsible for the deaths, since both variables may be related to heat and humidity Causation & Correlation