Download
1 / 5

E N D
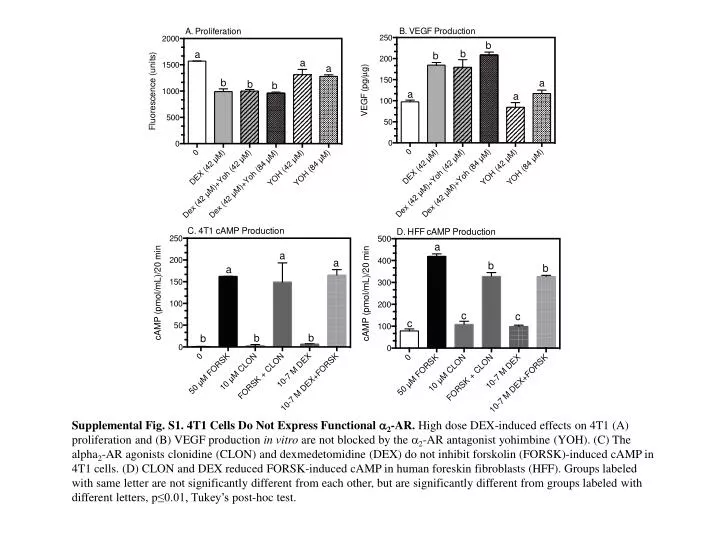
Supplemental Fig. S1. 4T1 Cells Do Not Express Functional a2-AR. High dose DEX-induced effects on 4T1 (A) proliferation and (B) VEGF production in vitro are not blocked by the a2-AR antagonist yohimbine (YOH). (C) The alpha2-AR agonists clonidine (CLON) and dexmedetomidine (DEX) do not inhibit forskolin (FORSK)-induced cAMP in 4T1 cells. (D) CLON and DEX reduced FORSK-induced cAMP in human foreskin fibroblasts (HFF). Groups labeled with same letter are not significantly different from each other, but are significantly different from groups labeled with different letters, p≤0.01, Tukey’s post-hoc test.
Supplemental Fig. S2. DMIElevates Spleen Norepinephrine (NE) and the NE Metabolite, Normetanephrine (NMN). Spleen (A) NE and (B) NMN were increased 3 days post-DMI pellet implantation. (C) Spleen weight was decreased day 3 post-DMI implantation. *** indicates significant differences versus corresponding placebo group, Holm-Sidakmultiple comparison test, p<0.001.
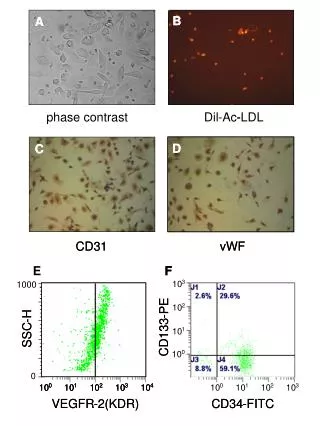
C. CD31+ blood vessels Supplemental Fig. S3. DMI-induced Tumor Growth is Not Associated with Altered Tumor Angiogenesis. Immunocytochemicalstaining of CD31+ blood vessels in tumor slices were quantified by two different methods: (A) percentage of pixels above threshold and (B) calculating the area of traced vessels per cell densitybased on nuclear DAPI staining (not shown). (C) A representative image of CD31+ blood vessels. Scale bar = 50 µm.
Supplemental Fig. S4. TNF-a Does Not Induce 4T1 Proliferation in Vitro. Results are expressed as mean ± SD of triplicate wells.
A. C. Supplemental Fig. S5. Tumor F4/80+ Macrophage Density Is Not Significantly Changed with A) DMI or B) DEX treatment. (C) Representative image of F4/80+ macrophages in a 4T1 tumor section by immunofluorescence; scale bar = 100 µm. Statistical analysis by Mann-Whitney (M-W) nonparametric test. B.