1 / 1

* *

A. B. * *. * *. #. *. *. *. #.

latoya
Download Presentation

* *

An Image/Link below is provided (as is) to download presentation Download Policy: Content on the Website is provided to you AS IS for your information and personal use and may not be sold / licensed / shared on other websites without getting consent from its author. Content is provided to you AS IS for your information and personal use only. Download presentation by click this link. While downloading, if for some reason you are not able to download a presentation, the publisher may have deleted the file from their server. During download, if you can't get a presentation, the file might be deleted by the publisher.

E N D

Presentation Transcript


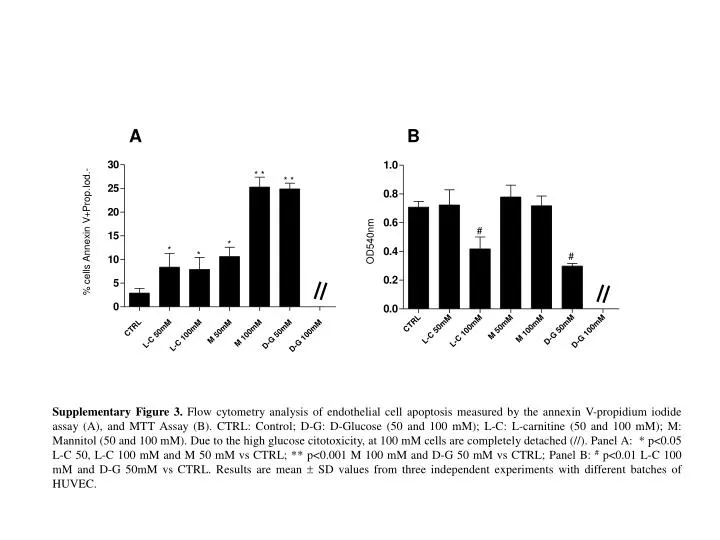
  1. A B * * * * # * * * # Supplementary Figure 3. Flow cytometry analysis of endothelial cell apoptosis measured by the annexin V-propidium iodide assay (A), and MTT Assay (B). CTRL: Control; D-G: D-Glucose (50 and 100 mM); L-C: L-carnitine (50 and 100 mM); M: Mannitol (50 and 100 mM). Due to the high glucose citotoxicity, at 100 mM cells are completely detached (//). Panel A: * p<0.05 L-C 50, L-C 100 mM and M 50 mM vs CTRL; ** p<0.001 M 100 mM and D-G 50 mM vs CTRL; Panel B: # p<0.01 L-C 100 mM and D-G 50mM vs CTRL. Results are mean  SD values from three independent experiments with different batches of HUVEC.

More Related