Download
1 / 33
330 likes | 432 Views
ACCOUNTING FOR THE PETRODOLLAR CONFERENCE Arthur Look Jack Institute of Business UWI. Sources and Uses of Hydrocarbon Wealth. A comparative Analysis 1974-79 and 1999-2004. Gregory McGuire Lecturer Energy Economics UWI St. Augustine. Nov-05. Presentation Outline.

E N D
ACCOUNTING FOR THE PETRODOLLAR CONFERENCE Arthur Look Jack Institute of Business UWI Sources and Uses of Hydrocarbon Wealth A comparative Analysis 1974-79 and 1999-2004 Gregory McGuire Lecturer Energy Economics UWI St. Augustine Nov-05
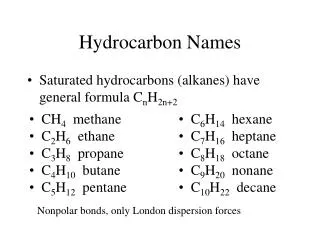
Presentation Outline • Simple Economic Model • Fiscal Operations Revenue Side • Aggregate Government Expenditure • Main Expenditure heads • Other Macro Economic Issues • Conclusion
Model of Economy • Onshore • Finance • Light Manufacturing • Construction • Services • Offshore • Exploration and Production • Petrochemicals • LNG • Services Revenue Government Non tradables ( Real Estate) Expenditure Social Services exports FX.earnings Foreign Exchange Spending Employment Prices
Offshore Economy • Largely Foreign owned firms • Production and plant management undertaken by nationals • Externally propelled firms • Firms are classic TNC and total institutions.
Offshore Economy • Offshore injections: Five main channels • Payments to labour and supervisory staff • Purchases of goods and services • Payment to service Companies • Dividends to National and regional conglomerates which hold equity
Onshore Economy • Cradle of nation’s economic activity. • National firms – SMEs • Engages nearly entire population • Determines the level of employment
State • Stands between the offshore engine: and the onshore carriage. • It raises revenue from taxes of firms in both sectors. • It spends on both current and capital accounts • Responsible for planning ad executing effective policies .
Model of Economy • Onshore • Finance • Light Manufacturing • Construction • Services • Offshore • Exploration and Production • Petrochemicals • LNG • Services Revenue Government Non tradables ( Real Estate) Expenditure Social Services exports FX.earnings Foreign Exchange Spending Employment Prices
Periods of Analysis • 1974-79: First five years of oil price inspired boom. • 1999- 04: First five years of volume induced boom – ALNG
Government Current Revenue1999-2004 • Ave growth rate16%/annum compounded, oil growing by 31%and non oil by 11% per annum. • Cumulative revenue TT $86 billion; oil share 32% or $TT 27 billion • Include 2005 data to September: Cumulative revenue = TT$ 114b.
Government Current Revenue1974-1979 • Ave growth rate 22 %/annum compounded, oil growing by 22 %and non oil by 24% per annum. • Cumulative revenue TT $15 billion; oil share 57 % or $TT 8.8 billion
Oil vs. Non Oil The official data suggests that oil revenues had a significantly larger share of the total Government revenue pie in the seventies than they do today.
What’s Missing? • “Oil Revenue” is narrowly defined to mean taxes and charges from companies under the Petroleum Taxes Act. • It does not include: • Taxes and Dividend Income from NGC. • Taxes and dividend income from the petrochemical companies, service companies engaged in the sector.. • Taxes from Atlantic LNG
Government Revenue • Revenue is at least 16 % higher than without with estimates of revenue from downstream companies
Expenditure Side. • Government expenditure provides the fuel for the onshore economy. • In a golden age, expenditure becomes the greatest challenge. – “ the imperative is to meet legitimate demands for equity while avoiding waste, expanding capacity and promoting transformation towards viability.”
Expenditure Pattern 1999-2005 Total recurrent expenditure amounted to $TT104 billion. Average growth rate 15% per annum compounded. Capital expenditure only 7.6 % of total
Expenditure Pattern 1974-79 Total recurrent expenditure amounted to $TT15 billion. Average growth rate 22% per annum compounded. Capital expenditure averaged 53% of total
Trends in Revenue and Expenditure 1999-2005 Recurrent expenditure growth= 15% per annum compounded, Revenue growth 16% per annum . What happens when rate of expansion of output or prices decline??
Trends in Revenue and Expenditure 1974-79 Recurrent expenditure growth= 27% per annum compounded, Revenue growth 22 % per annum . Total expenditure growth =24%
Some Observations • Given lower base and limited capacity o f the 1970’s , capital expenditure was slow to take off. Recurrent expenditure though was growing faster than revenue. • Classification of Capital expenditure has changed. For example in the 1970s some transfers to state enterprises were classified as Capital expenditure.
Some Observations • In current period much of capital expenditure are off budget making direct comparison difficult • State enterprises funding expansion. e.g. NGC/NEC fund both equity and capital projects without recourse to Government . • Special purpose companies responsible for financing major projects: e.g. UdeCott.
Some Observations • In current period much of capital expenditure are off budget making direct comparison difficult • We see welcome moves to build capacity outside energy in the form of Tamana Intech Park . • State appears to be shying away from direct investment. -
Distribution the Wealth The major shifts noted are : The greater share of Transfers and subsidies now 39% compared to 29% in the first period. Correspondingly ; Wages and salaries now only 30% as opposed to 39% earlier perhaps reflecting reduction in Public Service.
Some Observations • Very similar channels of distribution in both periods. • The absence of subsidies on cement and food due to economic liberalization policies in place since downturn. • Gasoline and electricity subsidy significant-could be worth upwards of TT $ 3 billion.
Saving For the Future • In the first period mechanism used was Funds For Long Term Development . • In 1980, there were 21 such Funds including : • Culture, National Parks, Transportation, Primary Schools. • Between 1974 and 1979- Total appropriation was TT$ 5,360 million. Interest earned was TT$ 400 million. Note : Data sourced from Accounting For the Petrodollar 1980.
Saving For the Future • In the second period mechanism used is Revenue Stabilization Fund. • Total of TT$ 5411 million up to end fiscal 2004-05. • Several unanswered questions.?
Saving For the Future • RSF allocations seem to be growing with income. • No set pattern, may well be a residual amount.
Concluding Remarks • Sources of Funds • Need for inclusion of downstream taxes and royalty in what is classified as “oil revenue”. • Need to publish disaggregated data. • Uses of Funds • Need for clear policy and rules on Heritage Fund as distinct from Stabilization Fund. • Return to approach of Funds for Long Term Development to aid sequencing of projects.
Concluding Remarks • Uses of Funds • Need for clear policy and rules on Heritage Fund as distinct from Stabilization Fund. • Need for general rules of fiscal policy • Return to approach of Funds for Long Term Development to aid sequencing of projects. • Greater emphasis required on transformation effort. Tamara seems to be a start , but I would rather build on agro industry and cultural products.