Download
1 / 43
430 likes | 524 Views
Initial results from a multi-year simulation of the NW European shelf seas. Roger Proctor , Jason Holt, Graham Tattersall, Sarah Wakelin Proudman Oceanographic Laboratory Liverpool, UK. Talk structure. Why do it? What’s happened in last 50 years? The model study Initial results Summary.

E N D
Initial results from a multi-year simulation of the NW European shelf seas Roger Proctor, Jason Holt, Graham Tattersall, Sarah WakelinProudman Oceanographic LaboratoryLiverpool, UK
Talk structure • Why do it? • What’s happened in last 50 years? • The model study • Initial results • Summary
Why do it? • Climate change is upon us • Need to understand its consequences • History best clue to the future • Need limits of predictability for future climate change • Need baseline values against which to deduce trend changes (for WFD* as well as planning) • Modelling challenge *EC Water Framework Directive
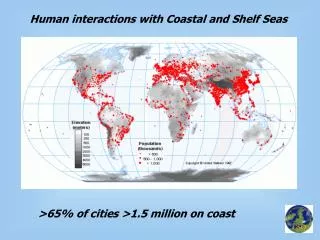
What’s happened in the last 50 years • Evidence from • weather • sea level (PSMSL) • Temperature & salinity (ICES database) • Continuous Plankton Recorder
ERA-40 period After Hurrell: www.cgd.ucar.edu/cas/jhurrell/indices.html
Effects of NAO Lerwick, NW Scotland (winter) 1982-2000 94/95 + 95/96 Extracts from the IACMST report – UK Marine Waters 2004: Marine Processes and Climate http://www.oceannet.org/medag/reports/IACMST_reports/MCP_report/index.htm -
Sea Level changes • Absolute rise ~ 1mm/y • Relative rise (mostly increasing, except N coasts) • decrease in the rate of rise in the 20th Century • no long-term trends in tides Wakelin et al. (2003) have shown that winter-mean (December to March) sea levels and the NAO Index are significantly correlated over much of the northwest European shelf.
Marine Environmental Change Network (MECN) • Establish a network to measure • environmental change in marine • waters • Maintain and enhance existing • long-term research programmes • Restart important discontinued • long-term research programmes • Deliver and interpret long-term and • broad scale contextual information to • inform water quality monitoring • Demonstrate the benefits of • preserving and networking long-term • time series programmes • Provide information to policy makers • and other end-users to enable them to • produce more accurate accurate • assessments of ecosystem state • Have a clearer understanding of factors • influencing change in marine ecosystems. MECN partners http://www.mba.ac.uk/MECN/about.htm
MECN Long time series measurements Tiree Passage W Scotland
Temperature – SST Atlantic ICES FRS
Temperature – SST North Sea Fair Isle N Scotland NAO accounts for 40-50% of winter SST variability in N Sea (Loewe, 1996) FRS ICES
Temperature • No clear trend in summer SST in the eastern North Atlantic since the 1950s, but a warming in winter SST since the early 1990s. • SST at the Continental Shelf Edge warmed between 0.12°C and 0.29°C over the past century. • Temperatures in the Rockall Trough were relatively low in the early 1990s but then increased. The highest temperatures reached in the 1990s were similar to those in the 1960s. • The Faroe Shetland Channel has become warmer over the last 40 years, with temperatures rising at a rate of approximately 0.3°C per decade from the late 1960s minimum. • Waters around the UK have been warming since the 1980s, with the trend more pronounced in the southern North Sea and the Irish Sea (between 0.5°C and 1.0°C per decade) than elsewhere (between 0.0°C and 0.5°C per decade). • There is a warming trend in winter and summer SST averaged over the northern North Sea since the early 1980s, with a warming of about 1°C and 0.5°C respectively. • North Sea winter bottom temperatures increased by about 0.3°C and 0.6°C per decade since a cool period in the late 1970s. • Irish Sea annual mean SST increased by about 0.7°C over the last 100 years. Winter SST from 1950 to 2002 shows a clear warming since the 1980s. An apparent cooling in summer SST since the 1980s may be due to sparse data.
Salinity – SSS North Sea GSA Fair Isle Almost cyclical variability since the end of the GSA in the 1970s ICES
Salinity • Atlantic waters and adjacent shelf areas had low winter and summer sea surface salinity (SSS) in the mid-late 1970s (associated with the passage of the Great Salinity Anomaly (GSA)), followed by three decades of large inter-annual variability. • Salinity records from the Faroe Shetland Channel and the Ellett line indicate a recent trend to high salinity. • SSS averaged over the northern North Sea from 1950 to 2002 shows decreasing salinity since the 1970s and is reflected by observations at fixed locations in the Fair Isle Current and the North Sea fishing grounds. • There is no discernible trend in mean SSS in the English Channel from 1900 to the early 1980s. • SSS averaged over the Irish Sea from 1950 to 2002 shows a decrease in both winter and summer.
The Continuous Plankton Recorder Long-term changes at the base of the food web • Phytoplankton abundance in North Sea and NE Atlantic Reid et al. (1998) Nature
The Continuous Plankton Recorder Biogeographic Changes in the Northeast Atlantic Warm temperate slope species Beaugrand et al. Science 2002
The model study • Using POLCOMS – POL Coastal Ocean Modelling System • Configured for ocean/shelf (AMM) • ERA-40 surface flux (SLP, 10m wind, bulk heat flux, E-P flux) • Daily river flux (mix of climatological and measured) • FOAM repeating annual cycle (2000/1)
POLCOMS • 3D Shallow Water equations • Horizontal finite difference discretization on an Arakawa B-grid • Spherical polar co-ordinates • Terrain following co-ordinates - horizontally varying S levels • Forward Time-Centred Space scheme in the horizontal • Equations split into depth-mean and depth-fluctuating components • Horizontal Advection • Piecewise Parabolic Method (PPM) for accurate, conservative representation of sharp gradients, fronts, thermoclines etc. • Horizontal pressure gradients • calculated by interpolation onto horizontal planes, improving numerical accuracy of S co-ordinates over steep topography • Vertical diffusion • Mellor-Yamada-Galperin level 2.5 turbulence closure scheme • GOTM (k-ε), Canuto stability functions
AMM-12km Atlantic Margin Model N Atlantic FOAM 1/9o (T,S, ζ, Q) ECMWF ERA-40 1957-2002 1 degree 6-hourly SLP, 10m wind, 2m AT, RH, CC, E-P Tides (9C, ζ, Q) River discharge Daily 323 rivers Physics (T,S, ζ, U,V) No data assimilation or relaxation to climatology Modules for spm, (light, nutrients, biology) - ERSEM
Lack of ocean time varying bc means features like GSA will not be simulated
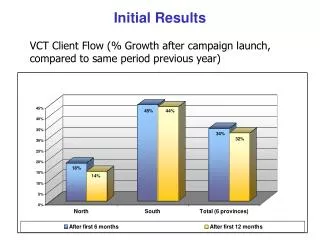
Initial results • Point series comparisons (Cypris, …) • ICES CTD database comparisons • Errors • Seasons • Trends
Irish Sea only (Holt&Young06) Cypris station – Irish Sea
ICES CTD database analysis Total 61,000 CTDs 20,000 this period (95-99)
Temperature errors – Oct-Dec 1995-99 Surface Near-bed
Winter Summer Salinity errors seasonal 1995-99 Surface Near-bed
Like-for-like trends ‘81-99 (min of 8 years & 5 obs/season / 1o cell)
Summary • 40 year simulation of NW European shelf without data assimilation successfully reproduces many of the trends seen in the ICES and MECN observed data • Model errors highest in spring (T) and NCC (S) • Effect of ‘climatic’ oceanic circulation not apparent • Model agrees better with obs when like-for-like measure used. Spatial variability allows error estimates to be made • Just the beginning, also started ecosystem runs
POLCOMS-ERSEM 15yr (1986-2001) Mean chl errors mg/m3 (against ICES data)