Download
1 / 50
510 likes | 717 Views
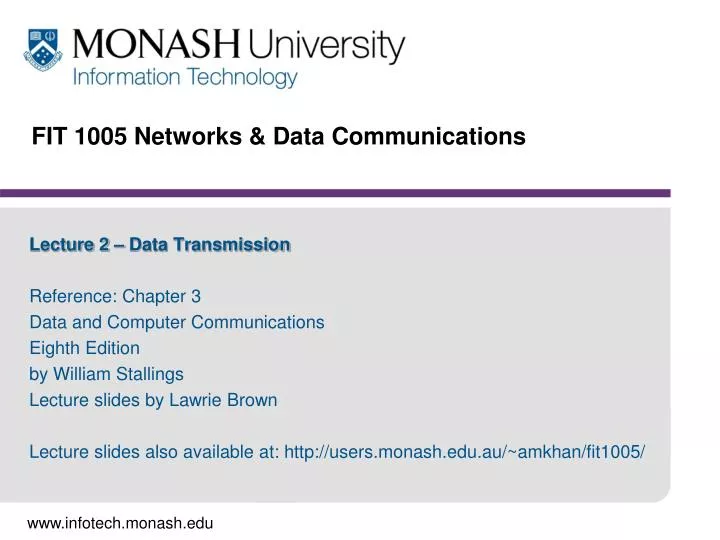
FIT 1005 Networks & Data Communications. Lecture 2 – Data Transmission Reference: Chapter 3 Data and Computer Communications Eighth Edition by William Stallings Lecture slides by Lawrie Brown Lecture slides also available at : http://users.monash.edu.au/~amkhan/fit1005/.

E N D
FIT 1005 Networks & Data Communications Lecture 2 – Data Transmission Reference: Chapter 3 Data and Computer Communications Eighth Edition by William Stallings Lecture slides by Lawrie Brown Lecture slides also available at: http://users.monash.edu.au/~amkhan/fit1005/
Data Transmission Terminology • data transmission occurs between a transmitter & receiver via some medium • guided medium • e.g. twisted pair, coaxial cable, optical fiber • unguided / wireless medium • e.g. air, water, vacuum
Data Transmission Terminology-2 • direct link • no intermediate devices • Except amplifiers or repeaters • point-to-point • direct link • only 2 devices share medium(link) • multi-point • more than two devices share the medium (link)
Data Transmission Terminology-3 • simplex • one direction • e.g. television • half duplex • either direction, but only one way at a time • e.g. police radio • full duplex • both directions at the same time • e.g. telephone
Frequency, Spectrum and Bandwidth • Time domain concepts: viewed as a function of time • Can be analog or digital • analog signal • varies in a smooth way over time • digital signal • maintains a constant level then changes to another constant level • periodic signal • pattern repeated over time • aperiodic signal • pattern not repeated over time
Sine Wave • peak amplitude (A) • maximum strength of signal • measured in volts (V) • frequency (f) • rate of change of signal • Hertz (Hz) or cycles per second • period (T) = time for one repetition • T = 1/f • phase () • relative position in time
Sine Wave - 2 • A sine wave can be represented as: s(t) = A sin(2ft + ) where: A – peak amplitude f – frequency t – time - phase angle t • - phase = Degrees Radians 00 = 0 450 = /4 900 = /2 1350 = 3/4 1800 = 00 =
Varying Sine Wavess(t) = A sin(2ft + ) (a) A=1, f =1, ø = 00 (b) A=0.5, f =1, ø = 00 (c) A=1, f =2, ø = 00 (d) A=1, f =1, ø = Π/4 = 450
Varying Sine Wavess(t) = A sin(2ft + ) (a) A=1, f =1, ø = 00 (b) A=0.5, f =1, ø = 00 (c) A=1, f =2, ø = 00 (d) A=1, f =1, ø = Π/4 = 450
Varying Sine Wavess(t) = A sin(2ft + ) (a) A=1, f =1, ø = 00 (b) A=0.5, f =1, ø = 00 (c) A=1, f =2, ø = 00 (d) A=1, f =1, ø = Π/4 = 450
Varying Sine Wavess(t) = A sin(2ft + ) (a) A=1, f =1, ø = 00 (b) A=0.5, f =1, ø = 00 (c) A=1, f =2, ø = 00 (d) A=1, f =1, ø = Π/4 = 450
Varying Sine Wavess(t) = A sin(2ft + ) (a) A=1, f =1, ø = 00 (b) A=0.5, f =1, ø = 00 (c) A=1, f =2, ø = 00 (d) A=1, f =1, ø = Π/4 = 450
Wavelength () • is distance occupied by one cycle • between two points of corresponding phase in two consecutive cycles • assuming that the signal velocity is vs then, we have: = vsT • or = vs / f (since T = 1/ f) • and so, vs = f • especially when vs = c c = 3*108 ms-1 (speed of light in free space)
Frequency Domain Concepts • signal are made up of many frequencies • components are sine waves • Fourier Analysis can shown that any signal is made up of component sine waves • can plot frequency domain functions Fourier Analysis: The complex wave at the top can be decomposed into the sum of the three simple sine waves shown here.
Addition of FrequencyComponents (T=1/f) • graph c is sum of graphs a & b S(t) = A * sin [ (2) f t ] • (a) = 1*sin[ (2) f t ] • (b) = 1/3 * sin[ (2) (3f) t ] • (c) = (4/) * { 1*sin[ (2) f t ] + 1/3 * sin[ (2) (3f) t ] } • The scaling factor of (4/) is used to produce the cumulative wave whose maximum peak amplitude is close to 1.
Frequency DomainRepresentations t • Frequency domain function of Fig 3.4c S(f) t f t S(t)
Frequency Domain Representations • Frequency domain function of single square pulse S(t) S(f) Fourier transform 1 - X/2 +X/2 t S(t) = 1 for time period -X/2 to +X/2 = 0 elsewhere S(f) = 1 X sin( f X) ----------------- f X Fourier transform reference Page-839 William Stallings
Frequency Domain Representations (Java Demo) • Fourier series representation of any given periodic signals • Can be represented as a sum of sine and cosine waveforms known as Fourier series. • reference Page-836 William Stallings • Fourier Series Applets in Java. • http://www.falstad.com/fourier/index.html • http://www.falstad.com/fourier/
Spectrum & Bandwidth • spectrum • range of all frequencies contained in signal • absolute bandwidth • width of spectrum • effective bandwidth • often just bandwidth • narrow band of frequencies containing most energy • DC Component • component of zero frequency
Data Rate and Bandwidth • any transmission system has a limited band of frequencies • this limits the data rate that can be carried • square wave have infinite frequency components and hence bandwidth • but most of its energy in focused in first few components (harmonics) • limited bandwidth increases distortion • have a direct relationship between data rate & bandwidth
Analog and Digital Data Transmission • data • entities that convey meaning • signals & signalling • electric or electromagnetic representations of data, physically propagates along medium • transmission • communication of data by propagation and processing of signals
Audio Signals • freq range 20Hz-20kHz (speech 100Hz-7kHz) • easily converted into electromagnetic signals • varying volume converted to varying voltage • can limit frequency range for voice channel to 300-3400Hz
Digital Data • as generated by computers etc. • has two dc components • bandwidth depends on data rate -5 volts
Advantages & Disadvantages of Digital Signals • cheaper than analog signalling • less susceptible to noise • but greater attenuation • digital now the preferred choice
Transmission Impairments • signal received may differ from signal transmitted causing impairment: • Analog transmission - degradation of signal quality • digital transmission - bit errors • most significant impairments are • attenuation and attenuation distortion • delay distortion • noise Lets see these impairments one by one!
Transmission Impairments: (1) Attenuation • where the signal strength falls off with distance • depends on transmission medium • It is a increasing function of frequency • received signal strength must be: • strong enough to be detected • sufficiently higher than noise so as to receive without error • so we increase strength using amplifiers/repeaters • so equalize attenuation across band of frequencies we use • e.g.. loading coils or amplifiers
Transmission Impairments: (2) Delay Distortion • only occurs in guided media • propagation velocity varies with frequency • hence various frequency components arrive at different times • particularly critical for digital data • because some of the signal components of one bit position will spill over into other bit positions, hence • causing inter-symbol interference
Transmission Impairments: (3) Noise • noise is the additional signals that is inserted between transmitter and receiver • (1) thermal noise • due to thermal agitation of electrons • Present in all electronic devices & transmission media • Function of temperature • uniformly distributed • cannot be eliminated • Also referred as white noise • (2) intermodulation noise • signals that are the sum and difference of original frequencies sharing a medium
Transmission Impairments: (3) Noise • crosstalk • a signal from one line is picked up by another • impulse • irregular pulses or spikes • eg. external electromagnetic interference • short duration • high amplitude • a minor annoyance for analog signals • but a major source of error in digital data • a noise spike could corrupt many bits
Channel Capacity • Channel capacity (C) is the maximum rate at which data can be transmitted over a given communication channel. • We need to consider: • Data rate, measured in bits per second (bps), is the rate at which data can be communicated. • The Bandwidth (B) of channel, measured in cycles per second or Hertz. • Noise, the average level across the communication channel. • Bit Error Rateon the channel resulting from the noise.
Channel Capacity and bandwidth • Communication facilities are expensive • Greater the bandwidth, more expense • Bandwidth limitations are due to physical properties of transmission mediums • want to make most efficient use of channel capacity • Other main constrain being noise
Nyquist Bandwidth • Nyquist formula (for noise free channels): Channel capacity, C = 2B ( two voltage level only) • if rate of signal transmission is 2B then it can carry signal with frequencies no greater than B Hz • i.e. given bandwidth B, highest signal rate is 2B bps • for binary(2) signals, a transmission rate of C=2B bps needs a bandwidth of B Hz • With multilevel signaling, the Nyquist formulation becomes: C = 2B log2M, (where M is the number of discrete signal or voltage levels.)
Nyquist Bandwidth: Example • In a noise free channel, the channel capacity, in bps, of the channel is at best twice the bandwidth of the channel. C=2B • As an example, consider a telephone line (voice channel) used to transmit digital data: • On a telephone channel with a frequency range from 300Hz to 3400Hz, • The bandwidth is B = f highest – f lowest B = 3400 – 300 = 3100Hz • Hence, the channel capacity is at best: C=2B C = 2 x 3100 = 6200 bps • This assumes two level (binary) signalling.
Nyquist Bandwidth -2 • In binary signalling, two voltage levels are used • The signal rate can be increased by using more than two signal levels (multilevels) • With multi-level signalling • Nyquist Formula is: C = 2B log2M where M is the number of voltage levels used • Increase the data rate by increasing signal voltage levels (multiple voltage levels) • at a cost of receiver complexity • Limitations are added by noise & other impairments
Shannon Capacity Formula • consider relation of data rate, noise & error rate • faster data rate shortens each bit, so bursts of noise affect more bits • given noise level, higher rates means more errors • Shannon developed formula relating these to signal-to-noise (SNR) ratio Capacity C = B log2(1+ SNR) • This is the theoretical maximum capacity • but we can only get lower capacity in practise • because formula only assumes white noise (thermal noise) • Signal to noise ratio is usually expressed in decibels dB SNRdB = 10 log10 (SNR)
Logarithms formulas / rules A = Log b N N = b A Logb (A B) = Logb(A) + Logb(B) Logb (A /B) = Logb(A) - Logb(B) Logb x b = x Logb 1 = 0 for any base b Logb (A ) = Logn(A) Logb b = 1 for any base b Logn(b) Logb (An) = n Logb(A)
Shannon Capacity Formula: Example • The spectrum(BW) of a channel is between 3 MHz to 4 MHz and SNRdB = 24 dB. Bandwidth (B)= (4 – 3) = 1 MHz 24 dB = 10 log10 (SNR) SNR = 102.4 SNR = 251 • What is the capacity of the channel? Using Shannon’s formula, C = 106 x log2(1+ 251) ≈ 106 x 8 = 8 Mbps • How many signalling levels are required to achieve this capacity of 8 Mbps? Using Nyquist formula: C = 2B log2M 8 106 = 2 x 10⁶ x log2M 4 = log2M M = 24 M = 16
Decibels and Signal Strength Amplifiers and Repeaters: • Signal strength: important parameter in communication systems • Loss or attenuation of signal strength • Amplifiers: regain signal strength (used in analog systems) • Repeaters: regenerate signals used in digital networks
Decibels and Signal Strength- 2 Decibel (dB) • Signal strength: gain or loss is expressed in dB • Decibel is a ratio of two signal levels, say output and input of a communication system • The ratio could be Power i/p to Power o/p • Or the ratio of signal power to noise power • Or signal voltage to noise voltage • Or signal i/p voltage to o/p voltage • As long as it the ratio measured in a special way called decibels and expressed as dB • These ratios can be +ve or –ve also known as Gain or Loss
Decibels and Signal Strength- 3 Gain or Loss in dB • Signal Power Gain (or simply Gain) in dB is: GdB = 10 log10 Pout / Pin where Pin = input power level Pout = output power level log10 = logarithm to the base 10 • Loss in dB is: LdB = - 10 log10 (Pout / Pin ) or = 10 log10 (Pin / Pout )
Decibels and Signal Strength- 4 Example: If a signal with power level of 10 mW is inserted at the input of a communication system and a power of 5 mW is extracted at the output, calculate the loss in dB. LdB = 10 log10 Pin / Pout = 10 log10 (10 mW) / (5 mW) = 10 log10 (2) = 10 log10 2 = 10 x 0.3 = 3 dB. Pout = 5 mW Pin =10 mW LdB = -10 log10 Pout / Pin = -10 log10 (5 mW) / (10 mW) = -10 log10 (0.5) = -10 log10 0.5 = 10 x - 0.3 = 3 dB. OR
Decibels and Signal Strength- 5 Decibel can also be used as a ratio of input voltage to output voltage in a communication system: LdB = 10 log10 Pin / Pout = 10 log10 [(V2in )/R] / [(V2out )/R] = 2 x 10 log10 Vin / Vout = 20 x log10 Vin / Vout where P = V2 / R
Decibels and Signal Strength- 6 • The decibel-Watt (dBW) is another common measure used in microwave systems:(which is referenced to 1W) PowerdBW = 10 log (PowerW / 1 W) • Decibel-milliWatt and decibel-millivolt are also defined: (which is referenced to 1mW or 1mV) PowerdBm = 10 log (PowermW / 1 mW) VoltagedBmV = 20 log (VoltagemV / 1 mV)
Summary • looked at data transmission issues • frequency, spectrum & bandwidth • analog vs digital signals • transmission impairments • decibels and signal strengths