Download
1 / 11
110 likes | 196 Views
Figure 1 Groundwater in the City of Temecula, CA has been contaminated by MTBE releases from gas stations. Figure 2 RCWD Water Supply Well (#118) and its surrounding gas stations. Figure 3 Data Distribution Positively Skewed. Figures 4 Data Are Closer to Normal Distribution after

E N D
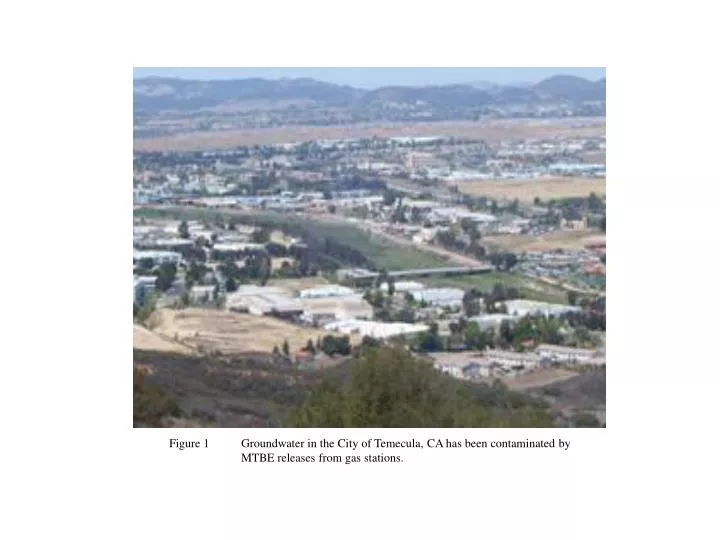
Figure 1 Groundwater in the City of Temecula, CA has been contaminated by MTBE releases from gas stations.
Figure 2 RCWD Water Supply Well (#118) and its surrounding gas stations
Figure 3 Data Distribution Positively Skewed Figures 4 Data Are Closer to Normal Distribution after Log Transformation
Figure 5 Spatial Autocorrelation between Each Pair of Sample Data Figure 6 Each Pair of Data Points Linked by the Lines
Range 26.28, is distance at which the Semivariogram model reaches its sill. Sill, The least semivariogram value in the data autocorrelation shape Color scale surface Figure 2 RCWD Water Supply Well (#118) and its surrounding gas stations Figure 7 A Spherical Model Developed for the Project
Figure 8 Anisotropy Calculates the Directional Influence of the MTBE Data
Figure 9 Predication of MTBE Concentration at a Specific Location
Ordinary Kriging Model Simple Kriging Model Figure 11 Comparison of Two Models’ Statistical Results
Figure 12 Prediction map of MTBE Concentration by Using Simple Kriging Model
Figure 13 Probability of MTBE Exceeding the Threshold of 20 ppd