Download
1 / 24
240 likes | 403 Views
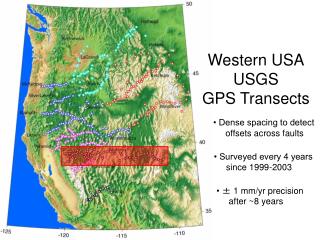
‘See Your Coast’ with Coastal Transects Analysis Model (CTAM). Ratana Chuenpagdee Memorial University of Newfoundland, Canada. CZ’07, Portland, July 25, 2007. Coastal governance challenges. Diverse, complex and dynamic natural and human systems; Scale issues;

E N D
‘See Your Coast’withCoastal Transects Analysis Model (CTAM) Ratana Chuenpagdee Memorial University of Newfoundland, Canada CZ’07, Portland, July 25, 2007
Coastal governance challenges • Diverse, complex and dynamic natural and human systems; • Scale issues; • Vulnerability and uncertainty (e.g., climate change, globalization); • Multiple resource users (e.g., small-scale fishers, large-scale fishers, fish farmers, tourists, coastal residents); • Local, national and global demands; • Occupational pluralism as livelihood strategies; and • Overlapping jurisdiction and lack of coordination.
The dilemma • High recognition of the need to: • understand connectivity and interactions among coastal areas’ natural, economic, social and governance systems; • prepare for the known and unknown events; • reconcile multiple demands and multiple objectives in coastal zones is appreciated • Tendency to develop sophisticated, technological-based and data-demanding models, which are often of limited use.
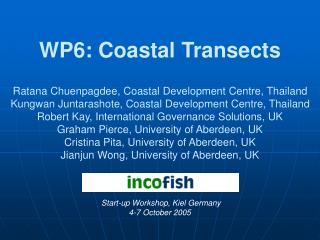
What is CTAM? • A simple on-line interactivevisualization and participatory tool aiming to assist, coastal practitioners, planners, policy makers and other stakeholders in addressing present and future demands in coastal areas; • Following Pauly and Lightfoot (1992), it divides the coast into transects and analyzes the interconnectedness between human activities and natural ecosystems; • The current focus is on fishing and fisheries-related activities and aquatic ecosystems.
Key features of CTAM • Simple, accessible, user-friendly, visually attractive; • Suitable for data-poor situations; • Exploration of possible outcomes; • Comparative analysis; and • Learning and sharing.
2Output of Survey – Showing activity icons on the coastal transect base map 1Online User Survey Input 3 MS Access Relational Dbase – Use ‘look-up’ table to match data inputs to a coastal transect type 5GIS Portal - showing related Coastal Transect types around the world 4Download Model - Coastal Transect and Associated Data Logistics flow diagram
Coastal transect types 70% of the 78 models are from developing countries.
Examples of estuary models showing variations in habitat complexity, fishing diversity and other coastal activities.
CTAM Phase II • Focuses on interactions and flows in the system; • ‘Fish Pool’ (total production from capture and culture fisheries) affected positively by habitat and management, negatively by fishing and other coastal activities; • Three types of flows: fish, cash and labor; • Weighting of ‘importance’ for estimation of interactions and flows are based on literature, expert judgments and local knowledge.
Habitats – varying positive contributions to fishery productivity depending on size and ‘health’ of habitats.
Fishing – varying negative impacts to fishery productivity depending on type of fisheries (inshore / offshore, small-scale / large-scale)
Fishing – varying negative impacts to fishery productivity depending also on gear type and fishing efforts.
Other activities – impacts from aquaculture, tourism and other coastal activities on fisheries productivity are incorporated.
Other considerations - include water quality, compatibility of tourism, aquaculture and fisheries, and stock status.
Flows – flow of fish, cash and labor from fisheries vary depending on ownership of boats and business and marketing channels.
Fisheries management tools and system • Common tools employed are gear, area and seasonal restrictions, and licenses and permits; • Out of 52 cases that indicate their management system, 77% is government, top-down, centralized control.
Further research and next steps • Transferring from FireFox to Internet Explorer; • Fine-tuning of the computation and algorithm for interactions and flows; • Internal error-checking, validity tests and sensitivity analysis; • Developing decision-making scenarios; • Participatory planning workshops with stakeholders; and • Comparative analysis of governability in coastal areas around the world.
CTAM is developed by: R. Chuenpagdee, K. Juntarashote, J. Bello & S. Traesupap Coastal Development Centre, Thailand R. Kay International Governance Solutions, UK G. Pierce, C. Pita & J. Wong University of Aberdeen, UK In collaboration with: E. Agbayani & R. Atanaci WorldFish Center, Phillippines As part of an INCOFISH Project (Integrating Multiple Demands on Coastal Zones with Emphasis on Aquatic Ecosystems and Fisheries, www.incofish.org), through funding from the European Commission (Project no. INCO 003739)
www.coastaltransects.org Thank you for your attention!
… … … … … … … … Interactions and flows in Chumporn, Thailand Fish flow Cash flow Labor flow