Download
1 / 13
130 likes | 245 Views
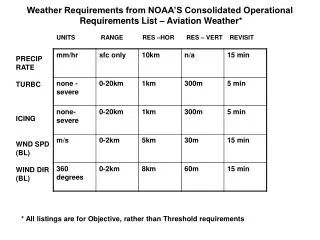
Applying FAA Aviation Weather Metrics Program Research to Operational Benefits Evaluations. Mike Robinson AvMet Applications, Inc. FPAW - 2012. NBAA Orlando, FL. Challenges to Quantifying Operational Benefits Attributed to Enhanced Weather Forecasts. “Of course delays were down this July

E N D
Applying FAA Aviation Weather Metrics Program Research to Operational Benefits Evaluations Mike Robinson AvMet Applications, Inc FPAW - 2012 NBAA Orlando, FL
Challenges to Quantifying Operational Benefits Attributed to Enhanced Weather Forecasts “Of course delays were down this July compared to last…..there was 60% less convection!” • Normalizing for similar weather events • Normalizing for similar operations • Defining pertinent baselines; How much of impact was “unavoidable” • Attributing improved decisions to (a) improved forecasts, (b) USE of improved forecasts • Providing objective, data-driven, quantified benefits estimates “Of course delays are down, ORD demand was down 20%!” “What do you mean you have no way to apply this new forecast?” (Said during solid ME to Gulf line) “Weren’t those delay improvements Associated with that new procedure / TMI? you say delays were saved during all 200 days of convection in ZMA Center….how often were improved decisions derived from this new forecast? “We are in a tight fiscal environment…. I am not going to just take your word that this new forecast increases operational efficiency!”
FAA ANG-C6 Aviation Weather Metrics Program • Emphasis on: • Weather impacts in context of operations (specifically, operational • decision-making) • Weather event normalization and baselining • Objective, relational data analysis (and simulation support)
Weather Impact Traffic Index (WITI)Weather Weighted by Traffic WITI is a weighted sum of three components: • En-route Component: hourly frequency on major flows X amount of convective Wx that these flows cross • Terminal Component • Linear part:capacity degradation due to terminal weather impact, proportional to number of ops • Non-linear (Queuing Delay) partreflecting excess traffic demand vs. capacity • Used by the FAA and NWS on a regular basis: • Macroscopic system performance measure in an objective manner – weekly reports • Compare different seasons’ Wx/traffic impact with outcomes (e.g. delays) 4
Historical Scalable Record of WITI / WITI – Forecast Accuracy (FA) Region - Hourly Airport – Hourly (IAH) NAS - Daily
Assessing Components of Unavoidable Weather Impacts Bad Weather Unavoidable Reasonable risk mgmt Network effects Deficit Impact caused by en-route airspace Opportunities? Need to give preference to departures Natural “Inertia” (time to ramp up) Operationally Beneficial Delay (slight arrival oversupply) Accidents, outages, VIP flights, security, etc Airlines’ business practices (e.g. related to cancellations) Opportunities? Airspace design, procedures Inaccurate forecast Opportunities Overly conservative TMI TMI execution (in excess of risk mgmt) En-route to Terminal to Final Transition
Estimating Unavoidable Arrival Delay Mean: 44% STD: 10% • Modeled estimated • unavoidable arrival • delay 40-55% of • overall delay • Results similar to • independent estimates • of unavoidable delay • (e.g., REDAC report)
Similar Weather Impact Events (WX & Demand) Example: ORD – Varying impacts throughout the day, both convective and non-convective Wx may have been the same but there was less traffic in the morning ORD, 20 August 2009 - Airport Weather Impact Matrix WITI Values
Finding Similar Weather Impact Days Similar Weather Event/Impact Evaluation Portal (SWEEP) • Identify, rank, and inspect similar REGIONAL wx-impact days • Identify, rank, and inspect similar NAS wx-impact days
Dynamic Airspace Routing Tool What is DART? • Weather-Aware Superfast-Time NAS/ATM Simulation Model • Full ETMS flight plans • Terminal Wx (convective and non-convective), TRACON and En-route convective Wx: actual and forecasts; permeability • Airport RWY configurations and capacity (may be Wx-degraded) but no physical RWYs • Airspace (sector, Center) capacity (may be Wx-degraded) • TMIs (Playbook, GDP, GS, AFP, MIT) • - Can blend historically enforced TMIs and simulated TMIs • Reroutes, delays, Cnx, simulated airborne holding & diversions • User-definable rules, risk factors, equipage profiles, etc • Randomized Wx, airport/airspace capacity, Wx forecast, traffic • A “superfast-time” NAS simulation tool • Day-in-the-NAS (50,000+ flights and all the above detail) in 2-3 min • Abundant output on various aspects of NAS operations • Impact (cost) metrics include delay (airborne, ground, etc.) AND cancellations and diversions • Validation of DART includes all three primary impact metrics
Examining Alternative TMIs via DART Simulations Optimized solution:Airway J29 open to relieve traffic on VUZ playbook reroute; reduced MIT, less delay Non-optimal solution:VUZ playbook reroute traffic uses standard route; J29 closed; heavier MIT, longer delays Only the traffic using NAS Playbook reroutes is shown; Color-coding by delay: 0-15, 15-20, 30-60, 60-120, >120 min arrival delay
Weather-ATM Analysis and Visualization Environment (WAVE) • “Weather-Centric” air traffic / ATM analysis tool and research platform • Utilizes 1-min ETMS traffic data (flight information, flight plans, amendments, lat/lon/altitude positioning) • Can ingest and display any gridded or polygon-based weather product (diagnostic or forecast) • Engine for extensive analysis, utilizing multiple data types; output results in CSV format • Generate standard output reports, targeted for specific performance assessments accounting for weather / forecasts