Download
1 / 15
150 likes | 271 Views
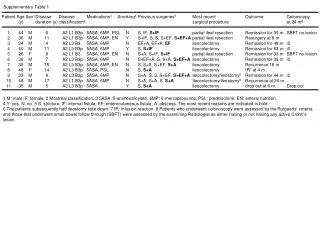
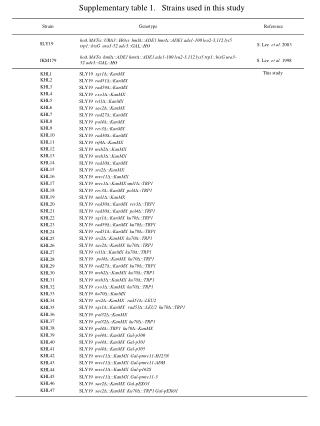
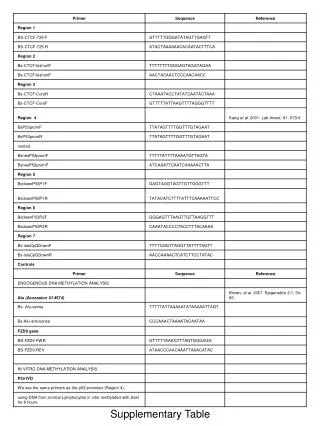
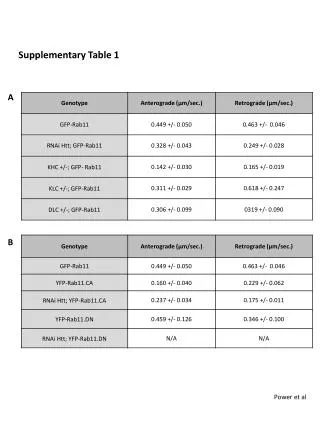
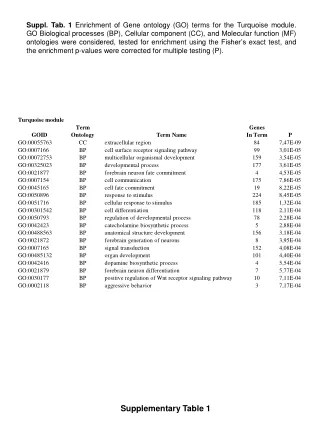
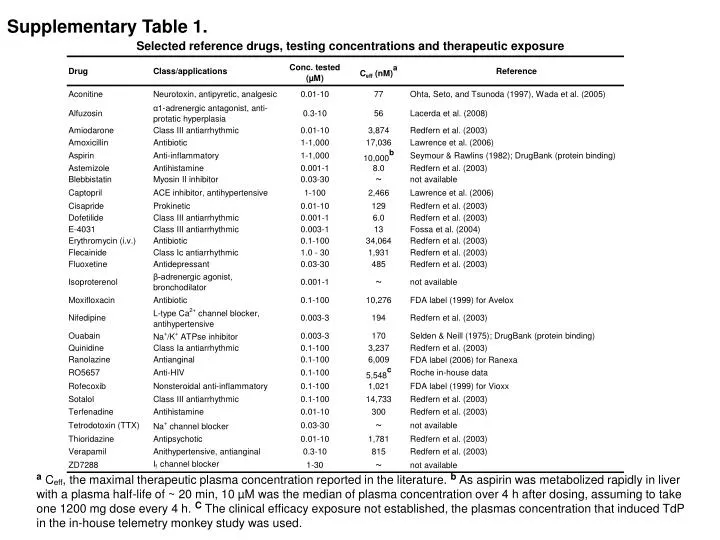
Supplementary Table 1. Selected reference drugs, testing concentrations and therapeutic exposure.

E N D
Supplementary Table 1. Selected reference drugs, testing concentrations and therapeutic exposure a Ceff, the maximal therapeutic plasma concentration reported in the literature. b As aspirin was metabolized rapidly in liver with a plasma half-life of ~ 20 min, 10 µM was the median of plasma concentration over 4 h after dosing, assuming to take one 1200 mg dose every 4 h. C The clinical efficacy exposure not established, the plasmas concentration that induced TdP in the in-house telemetry monkey study was used.
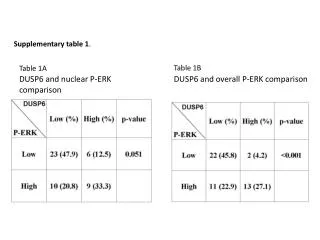
RI T IBR 120 12 0 113 14 0.21 428 32 0.88 Supplementary Figure 1. Suppl Fig. 1: Illustration of Irregular Beat Ratio (IBR) calculation. The screen-shots were taken from a 20 s-sweep window after exposure to the vehicle (0.1% DMSO, top trace) and E-4031 at 30 nM (middle trace) and 1000 nM (bottom trace), respectively. The regular (R) and irregular (I) beats were denoted by the blue-dots and red-arrowheads, respectively. The total (T) beats was a sum of R and I in each sweeps, and the IBR was calculated as the ratio of I/T.
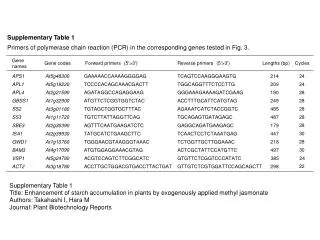
Supplementary Figure 2. Amoxicillin A Pre-drug Post-drug 30 min 1 h 6 h 24 h 72 h 0 µM 1 10 100 10 s Captopril B Pre-drug Post-drug 30 min 1 h 6 h 24 h 72 h 0 µM 1 10 100 10 s Suppl Fig. 2: Representative impedance traces for amoxicillin and captopril. No obvious irregular beats nor significant alteration in beat amplitude were observed during drug exposure from 1 to 100 µM and up to 72 h. The vertical scale bar = 0.08 CI.
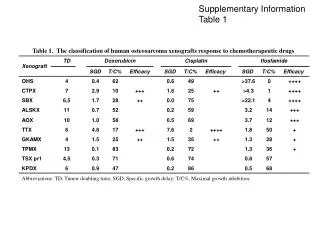
5 s Supplementary Figure 3. E-4031 A Pre-drug Post-drug 30 min 1 h 6 h 24 h 72 h 0 nM 1 3 10 30 100 300 1000 B Suppl Fig. 3: Dose- and time-dependent induction of arrhythmic beats by E-4031. A) Representative traces of RTCA Cardio recordings illustrate the development of the single, double, triple and short-train arrhythmic beats (denoted by arrowheads) that are induced dose-dependently by E-4031. Note, synchronous beats are arrested completely at 24 h and 72 h by 1000 nM, and at 72 h by 300 nM. The vertical scale bar = 0.1 CI. B) The Irregular Beat Ratio averaged from 3 e-plates (3 wells/conc.) was plotted as a function of time, demonstrating the rapid induction of arrhythmic beats that are persistent throughout the observation period at concentrations ≥ 100 nM. The standard error bars are not graphed for better clarity. RTCA Cardio (n = 3) Conc. (nM)
100 µV 5 s 0 nM 30 100 300 1000 Supplementary Figure 3. E-4031 C D MEA (n = 7) Suppl Fig. 3: Dose- and time-dependent induction of arrhythmic beats by E-4031. C) Representative traces of microelectrode array (MEA) recordings illustrate the development of the single, double, triple and short-train arrhythmic beats (denoted by arrowheads) induced dose-dependently by E-4031. D) The Irregular Beat Ratio averaged from 7 MEA wells was plotted as a function of concentrations to demonstrate the dose-dependent increase in arrhythmic beats induced by E-4031.
Supplementary Figure 4. 5 s RO5657 A Pre-drug Post-drug 30 min 1 h 6 h 24 h 72 h 0 µM 0.1 0.3 1 3 10 30 100 B Suppl Fig. 4: Dose- and time-dependent induction of arrhythmic beats by RO5657. A) Representative traces of RTCA Cardio recordings illustrate the development of typical arrhythmic beats (denoted by arrowheads), ventricular fibrillation or tachycardia-like (dark stars) arrhythmia that are induced dose-dependently by RO5657. Note, synchronous beats are arrested completely at 72 h by 100 µM. The vertical scale bar = 0.12 CI. B) The Irregular Beat Ratio averaged from 5 e-plates (5 wells /conc.) was plotted as a function of time to demonstrate the quick induction and dynamic change of arrhythmic beats throughout the observation period up to 72 h. The standard error bars are not graphed for better clarity. RTCA Cardio (n = 5) Conc. (µM) Irregular Beat Ratio Beat-rate Irregular Ratio
Supplementary Figure 4. 100 µV 5 s 0 µM 3 10 30 100 RO5657 C D MEA (n = 4) Irregular Beat Ratio Suppl Fig. 4: Dose- and time-dependent induction of arrhythmic beats by RO5657. C) Representative traces of microelectrode array (MEA) recordings illustrate the development of typical arrhythmic beats (denoted by arrowheads) induced dose-dependently by RO5657. D) The plot of Irregular Beat Ratio averaged from 4 MEA wells as a function of concentrations demonstrates the dose-dependent increase in arrhythmic beats induced by RO5657.
Supplementary Figure 5. 5 s Terfenadine A Pre-drug Post-drug 6 h 12 h 24 h 48 h 72 h 0 µM 0.01 0.03 0.1 0.3 1 3 10 Suppl Fig. 5: Dose- and time-dependent induction of arrhythmic beats by terfenadine. A) Representative traces of RTCA Cardio recordings illustrate the quick arrest of synchronous beatings and the development of typical arrhythmic beats (denoted by arrowheads) and ventricular fibrillation-like arrhythmia (dark stars) induced dose-dependently by terfenadine. Note, the time-dependent recovery of synchronous beats at concentrations ≥ 1 µM and the delayed induction of arrhythmic beats at concentrations ≥ 0.3 µM. The vertical scale bar = 0.1 CI. B) The Irregular Beat Ratio averaged from 3 e-plates (3 wells/conc.) was plotted as a function of time to demonstrate the delayed induction of arrhythmic beats. Arrhythmic beats occur after 12 h in exposure to terfenadine. The standard error bars are not graphed for better clarity. B Conc. (µM) RTCA Cardio (n = 3) Irregular Beat Ratio
Supplementary Figure 6. 5 s Thioridazine A Pre-drug Post-drug 6 h 12 h 24 h 48 h 72 h 0 µM 0.01 0.03 0.1 0.3 1 3 10 B Suppl Fig. 6: Dose- and time-dependent induction of arrhythmic beats by thioridazine. A) Representative traces of RTCA Cardio recordings illustrate the quick arrest of synchronous beatings and the development of typical arrhythmic beats (pointed with arrow heads) dose-dependently by terfenadine. Note, the time-dependent recovery of synchronous beats at 10 µM and the delayed induction of arrhythmic beats at concentrations ≥ 3 µM. The vertical scale bar = 0.12 CI. B) The Irregular Beat Ratio averaged from 3 e-plates (3 wells/conc.) was plotted as a function of time to demonstrate the delayed induction of arrhythmic beats. Arrhythmic beats occur after 48 h in exposure to thioridazine. The standard error bars are not graphed for better clarity. Conc. (µM) RTCA Cardio (n = 3) Irregular Beat Ratio
Supplementary Figure 7. 5 s Ranolazine A Pre-drug Post-drug 30 min 3 h 6 h 24 h 72 h 0 µM 0.01 0.03 1 3 10 30 100 B Suppl Fig. 7: Dose- and time-dependent induction of arrhythmic beats by ranolazine. A) Representative traces of RTCA Cardio recordings illustrate the slow development of typical arrhythmic beats (denoted by arrowheads) induced dose-dependently by ranolazine. Note, the frequent occurrence of arrhythmic beats at 3 h after exposure to the drug. The vertical scale bar = 0.08 CI. B) The plot of Irregular Beat Ratio averaged from 5 e-plates (5 wells/conc.) as a function of time demonstrates the slowly developed and transient induction of arrhythmic beats. Arrhythmic beats occur most frequently at 3 h after drug exposure. Conc. (µM) RTCA Cardio (n = 5)
Supplementary Figure 8. Verapamil Pre-drug Post-drug 3 h 18 h 24 h 48 h 72 h 0 nM 10 30 100 300 10 s Suppl Fig. 8: Dose- and time-dependent effects of verapamil. Reduction in beat amplitude and acceleration in beat rate were observed immediately after drug addition. Both changes recovered slowly and a complete recovery achieved at 48 h post-drug exposure. The vertical scale bar = 0.08 CI.
Supplementary Reference • Ogata, N., & Narahashi, T. Block of sodium channels by psychotropic drugs in single guinea-pig cardiac myocytes. British J Pharmacol, 97, 905-913. (1989). • Wada, K., et al. Effects of long-term administrations of aconitine on electrocardiogram and tissue concentrations of aconitine and its metabolites in mice. Forensic Sci International, 148, 21−29. (2005). • Lacerda, A.E. et al. Alfuzosin delays cardiac repolarization by a novel mechanism. JPharmacol Exp Ther. 324(2), 427-33. (2008). • Redfern, W.S. et al. Relationships between preclinical cardiac electrophysiology, clinical QT interval prolongation and torsade de pointes for a broad range of drugs: evidence for a provisional safety margin in drug development. Cardiovascular Res, 58, 32-45. (2003). • Lawrence, C.L., et al. A rabbit Langendorff heart proarrhythmia model: predictive value for clinical identification of Torsades de Pointes. British J of Pharmacol, 149, 845-860. (2006). • Seymour, R.A., & Rawlins, M.D. Efficacy and pharmacokinetics of aspirin in post-operative dental pain. Br J Clin Pharmacol.13(6), 807-10. (1982). • Selden, R., & Neill, W. A. Myocardial uptake of ouabain in intact dog and man. J Pharmacol Exp Ther, 193, 951−962. (1975). • Fossa, A. A., et al. Differential effect of HERG blocking agents on cardiac electrical alternans in the guinea pig. Eur J Pharmacol. 486(2), 209-21. (2004). • FDA label (2006) for Ranexa: • http://129.128.185.122/drugbank2/drugs/DB00243/fda_labels/147 • 10. FDA label (1999) for Avelox: • http://129.128.185.122/drugbank2/drugs/DB00218/fda_labels/389 • 11. FDA label (1999) for Vioxx: • http://129.128.185.122/drugbank2/drugs/DB00533/fda_labels/980
Supplementary Video 1 (legend) Supplementary Video 1: Representative videos depicting the contractility reduction of Blebbistatin, a myosin II Inhibitor on human iPSC-CMs. The 20 s video on the left shows pre-drug, iPSC-CMs beating at their typical rate and contraction. The 20 s video on the right depicts the same field of cells as on the left, after 15 min exposure of 1 µM Blebbistatin. While robust contractions are evident on the left, the contraction is severely reduced yet still present in the video on the right, in accordance with impedance traces. Additionally, focusing on specific cells present in both the left and right videos, it is apparent that there is no change in the beat rate, in accordance with both impedance and MEAs. For example, note the large, dark round cell cluster in the lower right corner of both videos; this cluster is beating at the same rate in both videos but the contraction is significantly muted in the right post-drug video. The cells depicted are plated onto an ordinary 96-well tissue culture plate in order to not have visuals imposed upon by impedance electrodes at 10 X magnification.
Supplementary Video 2 (legend) Supplementary Video 2: Representative video depicting the proarrhythmic effect of E-4031, a specific hERG inhibitor on iPSC-CMs. The 17 s video on the left shows pre-drug, iPSC-CMs beating with a consistent rate, size of the contraction and duration of each individual beat. The 17 s video on the right depicts the same field of cells as on the left, after 1 h exposure of 0.03 µM E-4031. Both videos begin with the onset of the first beat, with all beats numbered in yellow text. In the pre-drug movie, the entire field of cardiomyocytes beat synchronously at a regular frequency, approximately once every two seconds, for a total of 11 beats. In contrast, after E-4031 treatment, the same field of cells exhibit asynchronous beating, with a reduced frequency of large contractions and many smaller contracting, beats or twitches of single cells for at least a combined 15 regular and irregular beats/small twitches. These differences are best observed by looping the movie playback and observing each field separately. The cells depicted are plated onto glass cover slips in order to not have visuals imposed upon by impedance electrodes at 10 X magnification.
Supplementary Video 3 (legend) Supplementary Video 3: Representative videos depicting the fibrillation-like arrhythmia induced by ouabain, a Na+/K+-ATPase inhibitor on iPSC-CMs. The 20 s video on the left shows pre-drug, iPSC-CMs beating at their typical rate and contraction. The 20 s video on the right depicts the same field of cells as on the left, after 15 min exposure of 0.3 µM ouabain. A synchronous monolayer of cells is visible on the left video under pre-drug conditions. On the right, ouabain caused very rapid and asynchronous (fibrillation-like) contractions of individual cells. The cells depicted are plated onto an ordinary 96-well tissue culture plate in order to not have visuals imposed upon by impedance electrodes at 10 X magnification.