Download
1 / 54
560 likes | 657 Views
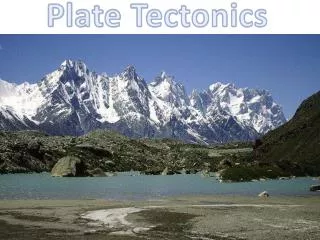
Plate Tectonics and Climate. Glaciation on Continents – The Polar Position Hypothesis. Two Key Testable Predictions When continents are near the poles they should have ice sheets If no continents are near the poles no ice sheets should appear on Earth

E N D
Glaciation on Continents –The Polar Position Hypothesis • Two Key Testable Predictions • When continents are near the poles they should have ice sheets • If no continents are near the poles no ice sheets should appear on Earth • Does not consider world-wide climate changes • Only considers positions of the continents
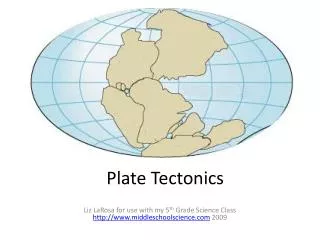
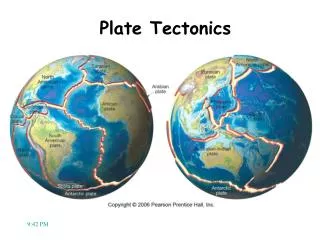
Seafloor Spreading Has Moved Continents • During the past 500 Myr continents have changed position between • Warm low latitudes • Colder higher latitudes • If latitude alone is the controlling factor, these movements should have produced predictable glaciations
South Pole Positions Correlate to Periods of Glaciation • Changes in the position of the pole • Slow movement of Gondwana across a stationary pole • 430 Myr ago • S. Pole position consistent with glaciation in the Sahara
South Pole Positions Correlate to Periods of Glaciation • From 325 to 240 Myr ago • Gondwana continues to move across the South Pole • A huge region on the southern continent was glaciated
South Pole Positions Correlate to Periods of Glaciation • Gondwana’s glaciation ended about 240 Myr ago • It moved away from the pole and merged with northern continents forming Pangaea
The Polar Positions Hypothesis: Some inconsistencies • The first southern glaciation (430 Myr ago) • Brief in terms of geologic time • 1 to 10 Myr in duration • The slow motion of Gondwana across the South Pole doesn’t easily explain a brief period of glaciation
Lack of Ice Sheets on Land over the South Pole • Land existed at the South Pole for almost 100 Myr without glaciation • This argues against the hypothesis being the only requirement for large-scale glaciations.
Lack of Ice Sheets on Land over the South Pole • After the breakup of Pangaea Antarctica, India, and Australia moved back over the South Pole. • No ice developed • Antarctica remained directly over the pole from 125 Myr ago to almost 35 Myr ago, but free from ice. • Again, this argues against the hypothesis being the only requirement for large-scale glaciations.
Pangaea’s Climate • Extended from high northern latitudes to high southern latitudes • Almost symmetrical about the equator • Wedge-shaped tropical seaway indented the continent from the east • Represented almost 1/3 of Earth’s surface. It spanned: • 180o of longitude at it’s northern and southern limits, both near 70o latitude • ¼ of Earth’s circumference at the equator
Climate Models Input . .. • Sea Level • Rock evidence indicates S.L. comparable to today’s • Topography • To minimize errors caused by incorrect guess as to the distribution of mountains • Interior land represented as a low-elevation plateau with a uniform height of 1000 m and gradually sloping towards the sea along the continental margins
Climate Models Input . .. • Higher CO2 level than today • Compensates for a weaker Sun (about 1%) • This is because geologic evidence indicates a warmer Earth • Absence of polar ice • Fossil vegetation • Palm-like trees at latitudes as high as 40o were not killed by hard freezes on Pangaea • Indicates that the hard freeze limit was at a higher latitude than today’s limit of 30o to 40o
Precipitation on Pangaea • Arid low latitudes, especially in the continental interior • Large land area under the dry, descending portion of the Hadley Cell • Large expanse of land in the tropics • Trade winds lose moisture by the time they reach the continental interior
Supported by Evaporite Deposits • Mesozoic Rifting • Opens the Atlantic • Evaporites in • shallow basins • Salts precipitated in lakes or in coastal margin basins • Limited exchanges of water with the ocean • Requires an arid climate • More evaporates precipitated during the later phases of Pangaea than during any time in the last several hundred million years
Temperatures on Pangaea Patterns switch back and forth between hemispheres with changes in the seasons. • Continental interior • Season extremes of heating in summer and cooling in winter • May explain lack of ice sheets in high latitudes because summers were so warm that rapid summer melting prevented the build-up of snow. • Freezing average daily winter temperatures extended to 40o latitude
Monsoons on Pangaea • Winter Hemisphere has high • pressure over the interior of • the continent • - Weak insolation and high • radiative cooling • - Air sinks building high • pressure • - Air flows out towards the • ocean • Strong reversal between summer and winter monsoon circulations • Summer Hemisphere has • strong solar heating • - Air rises and a strong low • pressure cell develops. • - Causes a net inflow of humid • air
Monson Circulation and Seasonal Precipitation • Eastern margins from 0o to 45o latitude • Winds reverse directions between seasons • Extremely wet summers • Dry winters
Geologic Evidence – Red Beds Permian – U.K. L. Permian, Triassic Palo Duro Canyon,TX Triassic - CA • Sedimentary rocks stained red by oxidation • Wet season provides the moisture • Rust forms in the dry season or interval • Red beds are widespread on Pangaea and is consistent with the model of high seasonal changes in moisture
Effect of Pangaea’s Breakup on Climate • Northern Hemisphere continents moved farther northward • High latitude ocean water displaced • Steeper global temperature gradient resulted
Change in Oceanic Circulation • A single ocean (Panthalassa) with a single continent • Simple pattern • Separate continents • More complex circulation • Affects atmospheric circulation • Warm an cold currents • Conveyer
The BLAG Spreading Rate Hypothesis • Also known as the Spreading Rate Hypothesis • Proposes that climate changes in the last several hundred million years: • Caused mostly by changes in the rate of CO2 input to the atmosphere • CO2 input driven by plate tectonic processes • Named using initials of its authors • Robert Berna • Antonio Lasaga • And . . . • Robert Garrels
CO2 Released into the Atmosphere by Plate Tectonics • Most CO2 is released • At Mid Ocean ridges • By Subduction Volcanoes
CO2 Released into the Atmosphere by Plate Tectonics • A smaller input of CO2 is released at hot spots • Most are not associated with plate boundaries
Distribution of Hot Spots • Identified by volcanic activity and structural uplift within the last few million years
Rate of Seafloor Movement Controls Delivery of CO2 from Rocks into the Air • Rates of plate motion presently varies from plate to plate • South Pacific spreads up to 10X faster than the Mid-Atlantic Ridge
Age of the Seafloor • Magnetic data shows widely varying rates over millions of years • Continue to change
Fast Spreading • Larger releases of CO2 to the ocean • Results in faster subduction • Larger volumes of carbon-bearing sediment and rock melt
Increased CO2 Causes an Initial Shift Towards a Greenhouse Climate • Activates increased chemical weathering • combined effect of temperature, precipitation, and vegetation • CO2 drawn out of atmosphere at a faster rate • Negative Feedback
Slow Plate Movement • Slow CO2 input results in cooling
A Colder Icehouse Climate • Decreased chemical weathering • Decreased removal of CO2 (greater amount remains in the atmosphere • Reduces the rate of cooling • Negative Feedback
Carbon Cycling in the BLAG Hypothesis • Carbon cycles continuously between rock reservoir and the atmosphere
Removal of Carbon from the Atmosphere • Carbon from chemical weathering • Ends up in shells of marine life • Forms sediments when marine organisms die
Return of Carbon to the Atmosphere • Suduction • Some sediment is scraped off, eroded and redeposited • Most is taken into Earth’s interior • Doesn’t reach the mantle • Returned to the atmosphere by volcanism
Does Data Support BLAG? • Data does seem to support the BLAG Hypothesis
The Uplift Weathering Hypothesis • Asserts that chemical weathering is: • The active driver of climate change • Not just a negative feedback to BLAG
Available Surfaces Affect the Rate of Chemical Weathering • BLAG views chemical weathering as responding to three climate factors: • Temperature • Precipitation • Vegetation • The Uplift Weathering Hypothesis considers availability of fresh rock and mineral surfaces to be weathered • This exposure can override the combined effects of BLAG’s three factors
Rock Exposure and the Rate of Weathering • As rocks an minerals physically disintegrate, the total surface area of the particles increases
Increased Surface Area Results in a Faster Weathering Rate • The proportional increase of weathering far exceeds the estimated result from changes in temperature, precipitation, and vegetation.
Uplift and Weathering • Tectonics results in the uplifting of Earth’s crust and the formation of mountains at many plate boundaries. • In regions of uplift exposure of freshly fragmented rock is enhanced.
Factors Increasing Weathering Rates in Uplifting Areas • Steep Slopes • Erosional processes are unusually active • Higher frequency of earthquakes in young mountain regions along plate boundaries • Dislodge debris and further weaken bedrock
Factors Increasing Weathering Rates in Uplifting Areas • Steep Slopes • Erosional pocesses called Mass Wasting are unusually active • Rock slides and falls • Landslides • Flows of water saturated debris • Removal of overlying debris exposes fresh bedrock
Mass Wasting or Mass Movement is . . . • the movement in which • bedrock, • rock debris, • or soil • moves downslope in bulk, or as a mss, because of the pull ofgravity. • Examples
Talus An apron of fallen rock fragments that accumulates at the base of a cliff.
Yosemite Valley Rockfall, 1999 • Two 80,000 ton slabs of an overhang broke off • Slid a short distance over steep rock and then flew 500 meters, launched as if from a ski jump • They shattered upon impact and created a huge dust cloud.
Debris Slide • A coherent mass of debris moving along a surface • Rotational debris slide (slump) if the movement is along a curved surface. La Concita, CA (1995) Debris in the upper part remained mostly intact as it moved in blocks. Debris in the lower portion flowed with rotational sliding. Earthflow and Slumping
Earthflow Earthflow in Santa Tecia, El Salvador, January 13, 2001
Factors Increasing Weathering Rates in Uplifting Areas • Steep Slopes • Mountain Glaciation • Pulverizes underlying bedrock • Carries sediment to lower elevations • Increases regional rates of chemical weathering
Factors Increasing Weathering Rates in Uplifting Areas • Steep Slopes • Heavy precipitation generated on • High but narrow mountain belts • Intercept moisture carried by tropical easterlies and mid-latitude westerlies • Large plateaus create their only monsoonal circulation (e.g., Tibetan Plateau) by pulling moisture from adjacent oceans