Download
1 / 1
10 likes | 99 Views
AMPERE & SuperDARN: What’s in it for me? L. B. N. Clausen 1 , J. B. Baker 1 , J. M. Ruohoniemi 1 , B. J. Anderson 2 , C. L. Waters 3 1: SuperDARN HF Radar Group, Virginia Tech, Blacksburg, USA 2: Johns Hopkins University Applied Physics Laboratory, Laurel, USA

E N D
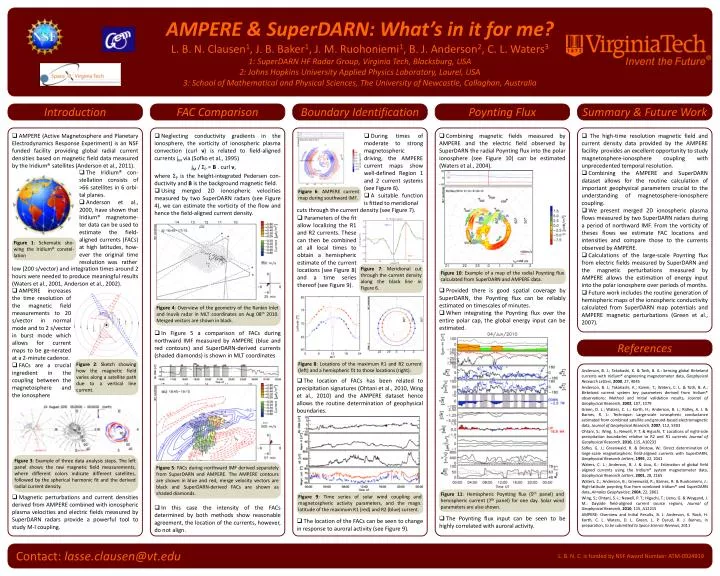
AMPERE & SuperDARN: What’s in it for me? L. B. N. Clausen1, J. B. Baker1, J. M. Ruohoniemi1, B. J. Anderson2, C. L. Waters3 1: SuperDARN HF Radar Group, Virginia Tech, Blacksburg, USA 2: Johns Hopkins University Applied Physics Laboratory, Laurel, USA 3: School of Mathematical and Physical Sciences, The University of Newcastle, Callaghan, Australia Introduction FAC Comparison Boundary Identification Poynting Flux Summary & Future Work • AMPERE (Active Magnetosphere and Planetary Electrodynamics Response Experiment) is an NSF funded facility providing global radial current densities based on magnetic field data measured by the Iridium® satellites (Anderson et al., 2011). • Neglecting conductivity gradients in the ionosphere, the vorticity of ionospheric plasma convection (curl v) is related to field-aligned currents jM via (Sofko et al., 1995) • jM / ΣP = B . curl v, • where ΣP is the height-integrated Pedersen con-ductivity and B is the background magnetic field. • Using merged 2D ionospheric velocities measured by two SuperDARN radars (see Figure 4), we can estimate the vorticity of the flow and hence the field-aligned current density. • During times of moderate to strong magnetospheric driving, the AMPERE current maps show well-defined Region 1 and 2 current systems (see Figure 6). • A suitable function is fitted to meridional • Combining magnetic fields measured by AMPERE and the electric field observed by SuperDARN the radial Poynting flux into the polar ionosphere (see Figure 10) can be estimated (Waters et al., 2004). • The high-time resolution magnetic field and current density data provided by the AMPERE facility provides an excellent opportunity to study magnetosphere-ionosphere coupling with unprecedented temporal resolution. • Combining the AMPERE and SuperDARN dataset allows for the routine calculation of important geophysical parameters crucial to the understanding of magnetosphere-ionosphere coupling. • We present merged 2D ionospheric plasma flows measured by two SuperDARN radars during a period of northward IMF. From the vorticity of theses flows we estimate FAC locations and intensities and compare those to the currents observed by AMPERE. • Calculations of the large-scale Poynting flux from electric fields measured by SuperDARN and the magnetic perturbations measured by AMPERE allows the estimation of energy input into the polar ionosphere over periods of months. • Future work includes the routine generation of hemispheric maps of the ionospheric conductivity calculated from SuperDARN map potentials and AMPERE magnetic perturbations (Green et al., 2007). • The Iridium® con-stellation consists of >66 satellites in 6 orbi-tal planes. • Anderson et al., 2000, have shown that Iridium® magnetome-ter data can be used to estimate the field-aligned currents (FACs) at high latitudes, how-ever the original time resolution was rather Figure 6: AMPERE current map during southward IMF. cuts through the current density (see Figure 7). • Parameters of the fit allow localizing the R1 and R2 currents. These can then be combined at all local times to obtain a hemispheric estimate of the current locations (see Figure 8) and a time series thereof (see Figure 9). Figure 1: Schematic sho-wing the Iridium® constel-lation low (200 s/vector) and integration times around 2 hours were needed to produce meaningful results (Waters et al., 2001, Anderson et al., 2002). Figure 7: Meridional cut through the current density along the black line in Figure 6. Figure 10: Example of a map of the radial Poynting flux calculated from SuperDARN and AMPERE data. • Provided there is good spatial coverage by SuperDARN, the Poynting flux can be reliably estimated on timescales of minutes. • When integrating the Poynting flux over the entire polar cap, the global energy input can be estimated. • AMPERE increases the time resolution of the magnetic field measurements to 20 s/vector in normal mode and to 2 s/vector in burst mode which allows for current maps to be ge-nerated at a 2-minute cadence. • FACs are a crucial ingredient in the coupling between the magnetosphere and the ionosphere Figure 4: Overview of the geometry of the Rankin Inlet and Inuvik radar in MLT coordinates on Aug 08th 2010. Merged vectors are shown in black. • In Figure 5 a comparison of FACs during northward IMF measured by AMPERE (blue and red contours) and SuperDARN-derived currents (shaded diamonds) is shown in MLT coordinates References Figure 2: Sketch showing how the magnetic field varies along a satellite path due to a vertical line current. Figure 8: Locations of the maximum R1 and R2 current (left) and a hemispheric fit to those locations (right). Anderson, B. J.; Takahashi, K. & Toth, B. A.: Sensing global Birkeland currents with Iridium® engineering magnetometer data, Geophysical Research Letters, 2000, 27, 4045 Anderson, B. J.; Takahashi, K.; Kamei, T.; Waters, C. L. & Toth, B. A.: Birkeland current system key parameters derived from Iridium® observations: Method and initial validation results, Journal of Geophysical Research, 2002, 107, 1079 Green, D. L.; Waters, C. L.; Korth, H.; Anderson, B. J.; Ridley, A. J. & Barnes, R. J.: Technique: Large-scale ionospheric conductance estimated from combined satellite and ground-based electromagnetic data, Journal of Geophysical Research, 2007, 112, 5303 Ohtani, S.; Wing, S.; Newell, P. T. & Higuchi, T. Locations of night-side precipitation boundaries relative to R2 and R1 currents Journal of Geophysical Research, 2010, 115, A10233 Sofko, G. J.; Greenwald, R. & Bristow, W.: Direct determination of large-scale magnetospheric field-aligned currents with SuperDARN, Geophysical Research Letters, 1995, 22, 2041 Waters, C. L.; Anderson, B. J. & Liou, K.: Estimation of global field aligned currents using the Iridium® system magnetometer data, Geophysical Research Letters, 2001, 28, 2165 Waters, C.; Anderson, B.; Greenwald, R.; Barnes, R. & Ruohoniemi, J.: High-latitude poynting flux from combined Iridium® and SuperDARN data, Annales Geophysicae, 2004, 22, 2861 Wing, S.; Ohtani, S.-i.; Newell, P. T.; Higuchi, T.; Ueno, G. & Weygand, J. M.: Dayside field-aligned current source regions, Journal of Geophysical Research, 2010, 115, A12215 AMPERE: Overview and Initial Results, B. J. Anderson, K. Rock, H. Korth, C. L. Waters, D. L. Green, L. P. Dyrud, R. J. Barnes, in preparation, to be submitted to Space Science Reviews, 2011 • The location of FACs has been related to precipitation signatures (Ohtani et al., 2010, Wing et al., 2010) and the AMPERE dataset hence allows the routine determination of geophysical boundaries. Figure 3: Example of three data analysis steps. The left panel shows the raw magnetic field measurements, where different colors indicate different satellites, followed by the spherical harmonic fit and the derived radial current density. Figure 5: FACs during northward IMF derived separately from SuperDARN and AMPERE. The AMPERE contours are shown in blue and red, merge velocity vectors are black and SuperDARN-derived FACs are shown as shaded diamonds. Figure 11: Hemispheric Poynting flux (5th panel) and hemispheric current (7th panel) for one day. Solar wind parameters are also shown. Figure 9: Time series of solar wind coupling and magnetospheric activity parameters, and the magn. latitude of the maximum R1 (red) and R2 (blue) current. • Magnetic perturbations and current densities derived from AMPERE combined with ionospheric plasma velocities and electric fields measured by SuperDARN radars provide a powerful tool to study M-I coupling. • In this case the intensity of the FACs determined by both methods show reasonable agreement, the location of the currents, however, do not align. • The Poynting flux input can be seen to be highly correlated with auroral activity. • The location of the FACs can be seen to change in response to auroral activity (see Figure 9). Contact: lasse.clausen@vt.edu L. B. N. C. is funded by NSF Award Number: ATM-0924919