Download

1 / 35
350 likes | 360 Views
By Lorie Darrow Select Actuarial. RESERVING TECHNIQUES. Topics. Fundamentals Situational Reserving Internal/External Forces Business Context/Pricing. The opinions expressed in this document are solely those of the presenter. Fundamentals of Loss Reserving. Definitions/Terminology

E N D
By Lorie Darrow Select Actuarial RESERVING TECHNIQUES
Topics • Fundamentals • Situational Reserving • Internal/External Forces • Business Context/Pricing The opinions expressed in this document are solely those of the presenter.
Fundamentals of Loss Reserving • Definitions/Terminology • Basic Reserving Techniques • Paid Loss Development Method (PLDM) • Incurred Loss Development Method (ILDM) • Expected Loss Ratio (ELR) • Bornhuetter-Ferguson (BF)
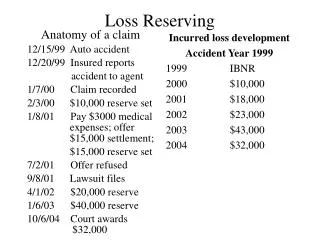
Basic Reserving TechniquesDefinitions • Loss Development The financial activity on claims from the time they occur to the time they are eventually settled and paid • Triangles Compiled to measure the changes in cumulative claim activity over time in order to estimate patterns of future activity • Loss Development Factor The ratio of losses at successive evaluations for a defined group of claims (e.g. accident year)
Examples of Reserving Issues • Immature Years • Claim Department Changes • Environmental Changes • Unique Exposures
Basic Reserving Techniques • Compilation of Paid Loss Triangle • The losses are sorted by the year in which the accident occurred • The losses are summed at the end of each year • Losses paid to date are shown on the most recent diagonal • The data is organized in this way to highlight historical patterns
Basic Reserving Techniques • Calendar Year Paid Losses by Accident Year
Ultimate Cumulative Paid Losses ($000 Omitted) Accident Total Development Stage in Months 12 24 36 48 60 72 Year Cost Yr 1 3,780 6,671 8,156 9,205 9,990 10,508 ??? Yr 2 4,212 7,541 9,351 10,639 11,536 ??? Yr 3 4,901 8,864 10,987 12,458 ??? Yr 4 5,708 10,268 12,699 ??? Yr 5 6,093 11,172 ??? Yr 6 6,962 ??? Basic Reserving Techniques Compilation of Paid Loss Triangle The goal is to estimate the total amount that will ultimately be paid
Basic Reserving Techniques:Paid Loss Development Factors Loss Development Factors (LDFs) are also known as: Age-to-Age factors Link Ratios
Accident Evaluation Interval in Months Year 12-24 24-36 36-48 48-60 60-72 72 to Ultimate Yr 1 1.765 1.223 1.129 1.085 1.052 Yr 2 1.790 1.240 1.138 1.084 Yr 3 1.809 1.240 1.134 Yr 4 1.799 1.237 Yr 5 1.834 Yr 6 Simple Average - All Years 1.800 1.235 1.134 1.085 1.052 Simple Average - Latest 3 Years 1.814 1.239 1.134 xxx xxx Simple Average - Excluding High & Low 1.800 1.239 1.134 xxx xxx Weighted Average - All Years 1.803 1.235 1.134 1.085 1.052 Selected Loss Development Factors 1.800 1.235 1.134 1.085 1.052 1.070 Basic Reserving Techniques:Paid Loss Development Factors
Accident Evaluation Interval in Months Year 12-24 24-36 36-48 48-60 60-72 72 to Ultimate Yr 1 1.765 1.223 1.129 1.085 1.052 1.070 Yr 2 1.790 1.240 1.138 1.084 1.052 1.070 Yr 3 1.809 1.240 1.134 1.085 1.052 1.070 Yr 4 1.799 1.237 1.134 1.085 1.052 1.070 Yr 5 1.834 1.235 1.134 1.085 1.052 1.070 Yr 6 1.800 1.235 1.134 1.085 1.052 1.070 Simple Average - All Years 1.800 1.235 1.134 1.085 1.052 Simple Average - Latest 3 Years 1.814 1.239 1.134 xxx xxx Simple Average - Excluding High & Low 1.800 1.239 1.134 xxx xxx Weighted Average - All Years 1.803 1.235 1.134 1.085 1.052 Selected Loss Development Factors 1.800 1.235 1.134 1.085 1.052 1.070 Basic Reserving Techniques:Paid Loss Development Factors
Evaluation Interval in Months 72 to 12-24 24-36 36-48 48-60 60-72 Ultimate LDFs 1.800 1.235 1.134 1.085 1.052 1.070 Cumulative Paid Losses ($000 Omitted) Ultimate Accident Development Stage in Months Total Year 12 24 36 48 60 72 Cost Yr 1 3,780 6,671 8,156 9,205 9,990 10,508 11,244 Yr 2 4,212 7,541 9,351 10,639 11,536 12,136 12,985 Yr 3 4,901 8,864 10,987 12,458 13,517 14,220 15,215 Yr 4 5,708 10,268 12,699 14,401 15,625 16,437 17,588 Yr 5 6,093 11,172 13,797 15,646 16,976 17,859 19,109 Yr 6 6,962 12,532 15,477 17,550 19,042 20,032 21,435 Sample Calculations for Accident Year 2003: At 24 Months: 12,532 = 6,962 x 1.800 At 36 Months: 15,477 = 12,532 x 1.235 or 15,477 = 6,962 x 1.800 x 1.235 Cumulative Development Factors 12 to Ult 24 to Ult 36 to Ult 48 to Ult 60 to Ult 72 to Ult 3.079 1.710 1.385 1.221 1.126 1.070 Basic Reserving Techniques:Application of Paid LDM
Actual Cumulative Estimated Estimated Development Paid Ultimate Loss Accident Losses Selected Factors to Losses Reserves Year @ Yr 6 LDFs Ultimate [(2) x (4)] [(5) - (2)] (1) (2) (3) (4) (5) (6) Yr 1 10,508 1.070 1.070 11,244 736 Yr 2 11,536 1.052 1.126 12,985 1,449 Yr 3 12,458 1.085 1.221 15,215 2,757 Yr 4 12,699 1.134 1.385 17,588 4,889 Yr 5 11,172 1.235 1.710 19,109 7,937 Yr 6 6,962 1.800 3.079 21,435 14,473 Total 65,335 97,576 32,241 Basic Reserving Techniques:Paid LDM Projections & Reserves • Loss Reserve Estimate @ Yr 6 = $32.241 million
Effect on Estimates Given a 2% Increase in Paid Losses Tail Factor Paid Estimated Unpaid Accident Losses SelectedLDF's Ultimate Earned Losses Year @ Yr 6 LDF Age to Ult. Losses Premium @Yr6 Yr 1 10,508 1.070 1.090 11,454 18,168 946 Yr 2 11,536 1.052 1.147 13,232 21,995 1,696 Yr 3 12,458 1.085 1.244 15,498 24,173 3,040 Yr 4 12,699 1.134 1.411 17,918 25,534 5,219 Yr 5 11,172 1.235 1.743 19,473 31,341 8,301 Yr 6 6,962 1.800 3.137 21,840 38,469 14,878 Total 65,335 99,415 159,680 34,080 Estimated Unpaid Losses Based on Original PLDM 32,241 (Without the 2% Tail Factor Increase) Increase in Estimated Unpaid Losses Due to Increased Tail Factor 6% Selection of Tail Factors • How much difference does the tail factor selection make?
Case Reserves ($000 Omitted) Accident Development Stage in Months Year 12 24 36 48 60 72 Yr 1 5,657 4,176 2,936 1,987 1,145 742 Yr 2 6,428 4,664 3,300 2,051 1,189 Yr 3 7,074 4,968 3,251 1,955 Yr 4 7,635 5,174 3,367 Yr 5 8,376 5,604 Yr 6 9,599 Cumulative Reported Losses* ($000 Omitted) Ultimate Accident Development Stage in Months Total Year 12 24 36 48 60 72 Cost Yr 1 9,437 10,847 11,092 11,192 11,135 11,250 ??? Yr 2 10,640 12,205 12,651 12,690 12,725 ??? Yr 3 11,975 13,832 14,238 14,413 ??? Yr 4 13,343 15,442 16,066 ??? Yr 5 14,469 16,776 ??? Yr 6 16,561 ??? * = paid losses + case reserves Basic Reserving Techniques:Compilation of Incurred Loss Triangle
Accident Evaluation Interval in Months Year 12-24 24-36 36-48 48-60 60-72 72 to Ultimate Yr 1 1.149 1.023 1.009 0.995 1.010 Yr 2 1.147 1.037 1.003 1.003 Yr 3 1.155 1.029 1.012 Yr 4 1.157 1.040 Yr 5 1.159 Yr 6 Simple Average - All Years 1.153 1.032 1.008 0.999 1.010 Simple Average - Latest 3 Years 1.157 1.035 1.008 xxx xxx Simple Average - Excluding High & Low 1.154 1.033 1.009 xxx xxx Weighted Average - All Years 1.154 1.033 1.008 0.999 1.010 Selected Loss Development Factors 1.154 1.035 1.008 1.000 1.000 1.000 Selected Cumulative Development Factors to Ultimate 1.204 1.043 1.008 1.000 1.000 1.000 Basic Reserving Techniques:Selected Incurred LDFs
Actual Estimated Actual Estimated Reported Development Ultimate Paid Loss Accident Losses Factors to Losses Losses Reserves Year @ Yr 6 Ultimate [(2) x (3)] @ Yr 6 [(4) - (5)] (1) (2) (3) (4) (5) (6) Yr 1 11,250 1.000 11,250 10,508 742 Yr 2 12,725 1.000 12,725 11,536 1,189 Yr 3 14,413 1.000 14,413 12,458 1,955 Yr 4 16,066 1.008 16,195 12,699 3,496 Yr 5 16,776 1.043 17,502 11,172 6,330 Yr 6 16,561 1.204 19,939 6,962 12,977 Total 87,791 92,023 65,335 26,688 Basic Reserving Techniques:Incurred LDM Projections & Reserves
Basic Reserving Techniques:Issues to Consider for LDM Examples There are more motorcycle losses in the oldest years; Typical P&C no longer insures motorcycles. Typical P&C has begun writing more business in state X. In one year, there were bad ice storms at the end of December. late reporting caused unusually high development in the next year Issues to Consider Have there been any changes which might make the older years irrelevant? Are the more recent years better predictors of the future? Are there outlier points that need to be ignored or adjusted?
Comparison of Loss Development Methods • Underlying Assumptions • PLDM: No changes in the payment pattern • ILDM: No changes in case reserve adequacy Disadvantages Advantages PLDM: “Hard” data; no estimates involved ILDM: Uses all available information PLDM: May generate large, volatile loss development factors & take longer to develop to ultimate ILDM: Uses case reserves, which are estimates, to develop estimates of ultimate losses
Expected Loss Ratio Method • Expected Loss Ratio (ELR) • The anticipated ratio of projected ultimate losses to • earned premiums • Sources: • Pricing assumptions • Historical data such as Schedule P • Industry data
Expected Loss Ratio Method • Use when you have no history such as: • New product lines • Radical changes in product lines • Immature accident years for long tailed lines • Can generate negative reserves or negative IBNR if • Ultimate Losses<Paid Losses-MOST LIKELY • ILLOGICAL!!! • Ultimate Losses<Incurred Losses
Expected Loss Ratio • AdvantagesDisadvantages • Straight forward Not pure • Relies on pricing Relies on pricing
Bornhuetter-Ferguson Method • Reserves Base on ELR and Actual Loss • (EP x ELR) x (IBNR Factor) = (IBNR Reserves) • Where IBNR Factor = (1.000-1.000/CDF) • Actual + IBNR Reserve = Ultimate Losses • Case Reserves + IBNR Reserve = Total Reserve • The IBNR Factor is the percent of the expected losses • unreported.
Bornhuetter-Ferguson Method Disadvantages Assumes that case development is unrelated to reported losses Relies on accuracy of expected loss ratio Less responsive to losses incurred to date Relies on accuracy of earned premium Advantages Compromise between loss development and expected loss ratio methods Avoids overreaction to unexpected incurred losses to date Suitable for new or volatile line of business Can be used with no internal loss history Easy to use
Situation • Claim Department Changes • Paid to Incurred relationship changes – Munich Chain • Reserve strengthening or weakening - Berquist - Sherman
Situation • Exposure Change • Frequency and severity • Rate per unit of exposure • Mergers - mix change (state, line, segment) • Contractors - seasonality (summer vs. winter)
Situation • Environment • Small claims go away - type of claim (mix shift) • Frequency Severity will change • the development pattern
Unique Exposures : Methodology in estimating Unique liabilities • Asbestos – Science/no claims • -Ground up analysis • Credit Crunch – D&O and E&O • Construction Defect