Download
1 / 29
290 likes | 381 Views
Carbon balance of a cutover bog in the Jura mountains at different stages of regeneration. Estelle Bortoluzzi 1,2 and Steve Chapman 3. 1 University of Nantes, France 2 University of Franche-Comté, France 3 Macaulay Institute, Aberdeen, Scotland. 2.

E N D
Carbon balance of a cutover bog in the Jura mountains at different stages of regeneration Estelle Bortoluzzi1,2 and Steve Chapman3 1 University of Nantes, France 2 University of Franche-Comté, France 3 Macaulay Institute, Aberdeen, Scotland
2 A considerable stake in the actual context : as illustrated by these extracts of the Kyoto Protocol (1992) : Article 7 ”1. Each Party (...) shall incorporate in its annual inventory of anthropogenic emissions by sources and removals by sinks of greenhouse gases (...)” Article 10b (ii) ”Parties (...) contribute to addressing climate change and its adverse impacts, including the abatement of increases in greenhouse gas emissions, and enhancement of and removals by sinks (...)” Peatlands : carbon sinks
3 Carbon sink EEN After exploitation, carbon sink ? At which time in the regeneration process does the peatland again become a carbon sink? - Rh - FCH4 GP - Ra CO2 CO2 CO2 This is one of the problematic issues of the European project RECIPE. CO2 TOC RE CH4
4 The role of the key vegetation communities in the re-establishment of a carbon sink. The compartmentation of carbon fluxes. The building of an empirical model in order to establish a carbon balance for different stages of regeneration. Objectives :
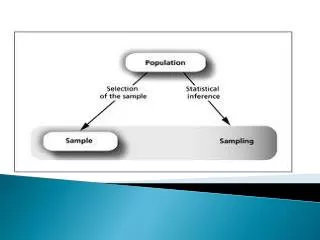
5 Objectives : Different stages of regeneration RE Monitoring of CO2 fluxes EENsat GPsat EEN Monitoring of CH4 fluxes Biotic and abiotic factors influencing them Empirical modelling equations Carbon flux simulation (per day) Carbon balance Recording of biotic and abiotic factors (all the year) Effects of vegetal community
2 . Materials and methods
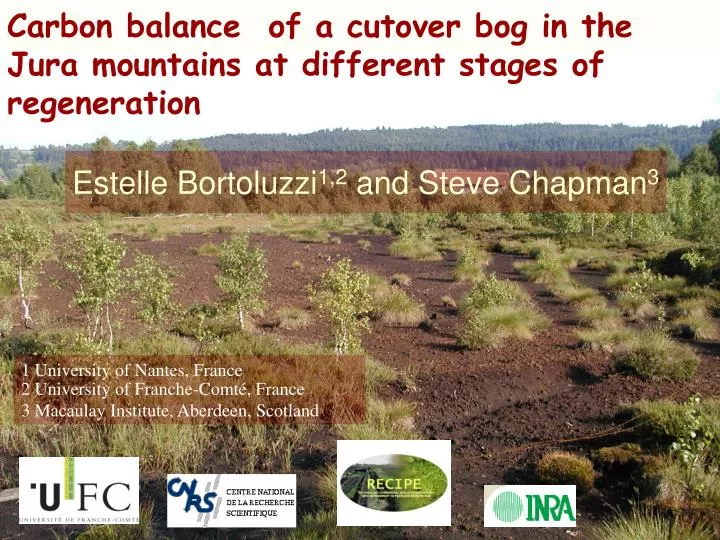
6 E. Bortoluzzi Studied site • A bog in the Jura mountains (860m), exploited for horticulture since 1984, visited yesterday. • Different stages of regeneration.
7 Bare peat The monitored stations E. Bortoluzzi Advanced regeneration Recent regeneration
8 Survey during 2 years (except with snow cover) : E. Bortoluzzi E. Bortoluzzi Measurements of CO2 fluxes • 11 collars dispatched on the 3 regeneration stages. • Measurements made with an IRGA (CIRAS 1, ppsystems, U.K.) and an open chamber. • For EENsat and RE • Campaign 2004 : once per week (26 days of data acquisition). • Campaign 2005 : once per three weeks (8 days of data acquisition). • For EEN without light saturation • Measurements with artificial shading.
9 Following during the fluxes measurements : Air temperature and PPFD. Temperature at 5, 10 and 50 cm. Water table level. E. Bortoluzzi Abiotic and biotic factors • Data acquisition during all the year • (time step = ½ h) : • - Global radiation. • - Air temperature. • Peat temperature at 5 and 30 cm. • Vegetation index (VI) (between 0 to 1) built with : • - Foliar Index (IF) for vascular plants. • Bryophyte index (BI). • Visual index of bryophyte dessication (DI).
10 E. Bortoluzzi Methane fluxes - CH4 fluxes followed during the two years at each season. - Incubation in closed and dark chambers. - Three samples over 75 min in vacuum tubes (analysed with a micro-GC).
2 . Results And discussion
11 RE function of temperature. Best answer with : Air temperature Power function RE(µmoleCO2 m-2 s-1) Bare peat R. Recent R. advanced TA (°C) Residuals of RE(µmoleCO2 m-2 s-1) Bare peat WT (water table level) (m) Key factors of RE • On bare peat : • Residuals linked with the water table level.
12 Respiration Air temperature : - First factor which explains RE variations (Lafleur et al. 2005). Water table level : Bare peat with high water table level : low CO2 fluxes. Vegetation index : High contribution to respiration. Growth photosynthesis and Net Ecosystem Exchange Bryophyte desiccation : key factor for PGsat Vegetation index : takes into account both types of vegetation Good simulation - at the site - at the intra-site micro-heterogeneity - at the variations between the two years of measurements. CO2 fluxes discussion
13 -Low fluxes. The highest fluxes in the recent regeneration. The lowest fluxes on bare peat. - High intra-site variability. FCH4 (nmole m-2 s-1) Bare peat R. Recent R. Advanced Days of years 2004 and 2005 Methane fluxes
14 CH4 fluxes linked to foliar index, two possible types of interactions : Methane ducting Organic carbon availability (Mikkelä et al. 1995). Highly decomposed peat, low CH4 (Glatzel et al. 2004). CH4 fluxes and water table level : Concomitant augmentation of temperature. Comparison with the data of dissolved CH4 and CO2 along the peat profile (followed during the two years) : Additional information on the surface fluxes. Methane fluxes : discussion
15 FCO2 ( gC m-2 j-1) R. Advanced GP and RE EEN GP R. Recent GP and RE EEN EEN Bare Peat RE Days of years 2004 and 2005 Daily fluxes simulated
16 Effects of air temperature daily variations FCO2 ( gC m-2 j-1) Average TA (°C) R. Advanced GP and RE EEN TA R. Recent GP and RE EEN EEN Bare peat Days of years 2004 and 2005 Daily fluxes simulated GP RE
17 The two stages in regeneration : Carbon sink for both years, higher in the R. advanced. Bare peat : Weak carbon source. Carbon balance 2004( gC m-2 y-1) GP RE FCH4 Balance 2004 Bare peat R. recent R. advanced GP 197 ~ 306 284 ~ 474 RE -22 -121~ -207 -186 ~ -297 FCH4 -0.4 -1.5 ~ -2.8 -0.7 ~ -2.3 balance -22 67 ~ 118 93 ~ 175 2005 Bare peat R. recent R. advanced GP 279 ~ 379 359 ~ 525 Bare peat RE -19 ~ -31 -199 ~ -214 -233 ~ -340 - + FCH4 -0.2 ~ -0.6 -1.8 ~ -3.9 -0.5 ~ -2.7 - + R. recent balance -19 ~ -32 78 ~ 166 122 ~ 183 R. advanced Carbon balance Annual estimated carbon balance compartments (g C m-2 y-1)
2 . Conclusion and perspectives
18 Two distinct stages of regeneration : R. advanced, dominated by Sphagnum : Carbon sink slightly more elevated. Drought impact. R. recent, dominated by vascular plants : Weaker drought impact. More methane released. Vegetation and carbon fluxes Closed balance between those stages but different processes : • Several possible evolutions in the case of climate change. • A composite vegetation better adapted to the climate change in term of carbon balance.
19 Bog Restoration and carbon balance Low CO2 fluxes High WT level Bare peat If decomposed peat : low CH4 fluxes Low WT level High CO2 fluxes Return facilitated to a typical bog vegetation Hard to return to a typical bog vegetation low CH4 fluxes Vascular plants : - Bryophytes protected against drought - Increase of CH4 fluxes Bryophytes : - Good accumulation - Sensitivity to drought Favour a mixed vegetation
A better comprehension of physiological processes of the different key vegetal species and of microorganisms 20 Perspectives Starting up of more mechanistic models Scenario testing of climate changes or of restoration • Molecular and microscopic approaches of material degradation processes (RECIPE). • Isotopic measurements per key vegetal species and for different peat types. Measurements of CO2 fluxes at leaf or Sphagnum plant scale. Evaluation of C loss through DOC and VOC.
Merci, pour votre attention, à l’équipe du programme RECIPE, à l’équipe du Laboratoire de Chrono-Ecologie, au Laboratoire de Biologie Environnementale, Daniel Epron, Andy Siegenthaler, Daniel Gilbert et Alexandre Buttler.
Bare peat (brown) : without vegetation, Water table level near the surface all the year. Studied vegetation stages • Recent regeneration (orange) : • Majority of Eriophorum angustifolium and installation under them of Sphagnum fallax, S. rubellum and S. magellanicum and Polytrichum strictum. • advanced regeneration (pale green) : • - Eriophorum vaginatum and Sphagnum fallax, S. rubellum and S. magellanicum and Polytrichum strictum. • - Four times more bryophytes and less vascular plants than on the recent regeneration.
15 Threshold of light saturation at 500 µmol m-2 s-1. EEN (µmol m-2 s-1) PPFD (µmol m-2 s-1) E. Bortoluzzi Measurements of CO2 fluxes without light saturation The method keeping artificial shading: - Four levels of shading obtained under the threshold of saturation (between 400 to 70 µmol m-2 s-1).
16 Monitoring during the fluxes measurements : Air temperature and PPFD. Temperature at 5, 10 and 50 cm. Water table level. E. Bortoluzzi E. Bortoluzzi Abiotic factors • Data acquisition during all the year (time step = ½ h) : • - Global radiation. • - Air temperature. • Peat temperature at 5 and 30 cm.
17 Foliar Index (IF) for vascular plants : Length of marked leaves surface average. Number of leaves per collar. Biotic factors • Bryophytes index (BI) : • - Surface covered and density. • Visual index of bryophytes dessication (DI): • From 1 (completely dessicated) to 6 (flooded). • Vegetation index (VI) (between 0 to 1) :
36 Empirical model Empirical model : bare peat site Empirical model ; sites with vegetation