Download
1 / 14
140 likes | 270 Views
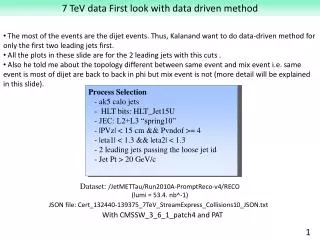
7 TeV data with data driven method variable bin sizes. Process Selection - ak5 calo jets - Trigger 0 AND (36 OR 37 OR 38 OR 39) - Scraping veto - Primary vertex: >= 4 DOF , |z| < 15 cm , |d0| < 2 cm - HLT bits: HLT_Jet15U - JEC: L2+L3 “spring10”

E N D
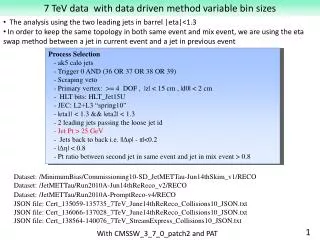
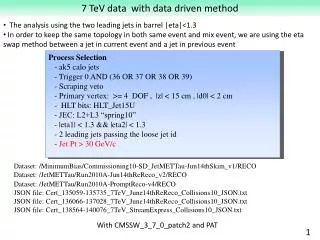
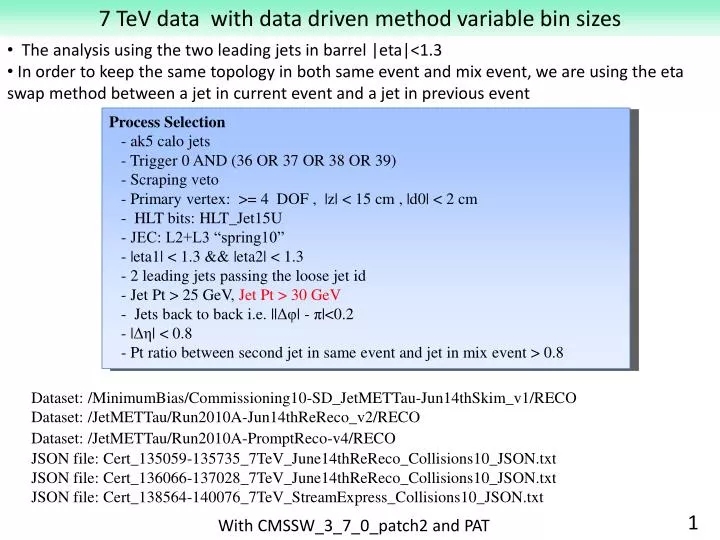
7 TeV data with data driven method variable bin sizes Process Selection - ak5 calo jets - Trigger 0 AND (36 OR 37 OR 38 OR 39) - Scraping veto - Primary vertex: >= 4 DOF , |z| < 15 cm , |d0| < 2 cm - HLT bits: HLT_Jet15U - JEC: L2+L3 “spring10” - |eta1| < 1.3 && |eta2| < 1.3 - 2 leading jets passing the loose jet id - Jet Pt > 25 GeV, Jet Pt > 30 GeV - Jets back to back i.e. ||Δφ| - π|<0.2 - |Δη| < 0.8 - Pt ratio between second jet in same event and jet in mix event > 0.8 1 • The analysis using the two leading jets in barrel |eta|<1.3 • In order to keep the same topology in both same event and mix event, we are using the eta swap method between a jet in current event and a jet in previous event Dataset: /MinimumBias/Commissioning10-SD_JetMETTau-Jun14thSkim_v1/RECODataset: /JetMETTau/Run2010A-Jun14thReReco_v2/RECO Dataset: /JetMETTau/Run2010A-PromptReco-v4/RECO JSON file: Cert_135059-135735_7TeV_June14thReReco_Collisions10_JSON.txtJSON file: Cert_136066-137028_7TeV_June14thReReco_Collisions10_JSON.txtJSON file: Cert_138564-140076_7TeV_StreamExpress_Collisions10_JSON.txt With CMSSW_3_7_0_patch2 and PAT
Comparisons between After subtraction of pT>25 and pT>30 2 From 50 to 150 GeV Detail on pT >30 is on http://highenergy.phys.ttu.edu/~keng/susy/plots/7TeV_DD_absEta08__Ptratio08_VarBinV4.pdf
7 TeV data with data driven method variable bin sizes Process Selection - ak5 calo jets - Trigger 0 AND (36 OR 37 OR 38 OR 39) - Scraping veto - Primary vertex: >= 4 DOF , |z| < 15 cm , |d0| < 2 cm - HLT bits: HLT_Jet15U - JEC: L2+L3 “spring10” - |eta1| < 1.3 && |eta2| < 1.3 - 2 leading jets passing the loose jet id - Jet Pt > 30 GeV - Jets back to back i.e. ||Δφ| - π|<0.2 - |Δη| < 0.8 - Pt ratio between second jet in same event and jet in mix event > 0.8 - Wight mix event with leading pT 3 • The next step is to weight the mix event properly in each Pt range to improve the subtraction power in the low mass region. We need to understand how the Pt spectrum of leading jet behave. Then find the proper bin size for each region. After we get this information we will weight mix event with number of entries in each bin/total entries. • The leading pT plots at http://highenergy.phys.ttu.edu/~keng/susy/plots/Leading_Pt.pdf Dataset: /MinimumBias/Commissioning10-SD_JetMETTau-Jun14thSkim_v1/RECODataset: /JetMETTau/Run2010A-Jun14thReReco_v2/RECO Dataset: /JetMETTau/Run2010A-PromptReco-v4/RECO JSON file: Cert_135059-135735_7TeV_June14thReReco_Collisions10_JSON.txtJSON file: Cert_136066-137028_7TeV_June14thReReco_Collisions10_JSON.txtJSON file: Cert_138564-140076_7TeV_StreamExpress_Collisions10_JSON.txt With CMSSW_3_7_0_patch2 and PAT
M(jj) of the two leading of same event and mix event Same Events Mixed Events 4 Bin size for each range 2 GeV/bin from 30 to 120 5 GeV/bin from 120 to 150 10 GeV/bin from 150-250 25 GeV/bin from 250-300 50 GeV/bin from 300-400 100 GeV/bin from 400-500
M(jj) of same event and mix event after normalizations Same event 200-500 GeV/c2 Mixed event after normalization Log Scale Normalization Region 5 Using area 200 to 500 GeV
Comparison between before and after subtraction After subtraction Before subtraction 6 Using area 200 to 500 GeV Zoom-in After subtraction
After subtraction 7 From 80 to 180 GeV Using area 200 to 500 GeV
Comparison after subtraction with and without leading pT weight 8 Using area 200 to 500 GeV
With Particle Flow Jets Process Selection - ak5 calo jets - Trigger 0 AND (36 OR 37 OR 38 OR 39) - Scraping veto - Primary vertex: >= 4 DOF , |z| < 15 cm , |d0| < 2 cm - HLT bits: HLT_Jet15U - JEC: L2+L3 “spring10” - |eta1| < 1.3 && |eta2| < 1.3 - 2 leading jets passing the loose jet id - Jet Pt > 30 GeV - Jets back to back i.e. ||Δφ| - π|<0.2 - |Δη| < 0.8 - Pt ratio between second jet in same event and jet in mix event > 0.8 - Wight mix event with leading pT 9 With CMSSW_3_7_0_patch2 and PAT
M(jj) of the two leading of same event and mix event Same Events Mixed Events 10 Bin size for each range 2 GeV/bin from 30 to 120 5 GeV/bin from 120 to 150 10 GeV/bin from 150-250 25 GeV/bin from 250-300 50 GeV/bin from 300-400 100 GeV/bin from 400-500
M(jj) of same event and mix event after normalizations Same event 200-500 GeV/c2 Mixed event after normalization Log Scale Normalization Region 11 Using area 200 to 500 GeV
Comparison between before and after subtraction After subtraction Before subtraction 12 Using area 200 to 500 GeV Zoom-in After subtraction
After subtraction 13 From 50 to 150 GeV Using area 200 to 500 GeV
Comparison after subtraction Calo and PF 14 Using area 200 to 500 GeV