Download
1 / 43
430 likes | 511 Views
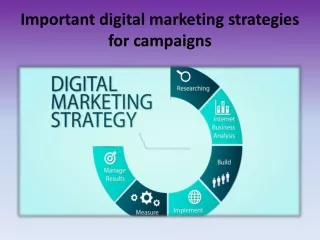
Simplify. Ross McNab | Director of Business Development | October 2009. Digital Campaigns. ?. how much. time. do you. spend with your. ad server. No Time For Strategy. ComplexAnalytics. Agency Profitability. CrossChannel Measurement. Multiple Sources of Data. Reporting.

E N D
Simplify Ross McNab | Director of Business Development| October 2009 Digital Campaigns
? how much time do you spend with your ad server
No Time For Strategy ComplexAnalytics Agency Profitability CrossChannel Measurement Multiple Sources of Data Reporting Trafficking Fatigue Getting Campaigns Live Ad Serving Not User Friendly Too Much Excel Delivery Campaign Performance Publisher Specs Little Time for Optimization Too much data, not enough time
effort work more more time less
The first step is to admit… Dysfunctional Campaign Process Analytic Complexities Inflexible Technology …we have a problem
? why
Current ad server platforms are built on decade old technology
Invested years million$ Spent 1 00s Interviewed
Actionable Analytics Streamlined Ad Serving Open Workflow
Actionable Analytics Extracting meaning out of piles of data
Difficulty: cross-channel results in real-time
Campaign Monitor • Analyze behavior throughout campaign in real-time • Optimize on-the-fly • Monitor status - delivery, performance, set-up, & more Updated data every 15 min
Difficulty: getting useable cross-channel data without hours in excel
1-Click PowerPoint • Full summary of campaign metrics • Customizable content • Complete with tables and graph
Streamlined Ad Serving Campaign set-up & measurement done faster & smarter
Difficulty: getting from point A to B quickly
Five Clicks Into One “ Process Guide Universal Serach Bookmarking Preview Filters
Difficulty: using previewing tools
Preview That Gives You the Whole View Preview multiple ads at once Instantly QA ad View ad info Collaborate with others
Difficulty: repetitive trafficking tasks
Hundreds of Banners, Only One Step Upload pairs of consistently named SWFs and GIFs Assign Clickthru URL to all ads
Difficulty: optimize creative in minutes
Switch Text, Content, or Targeting Instantly • Allows for quick optimizations and changes • Keeps record of any change • Keeps production cost down on revisions Smart Instantaneous creative update Versioning
Difficulty: F5 F5 F5 F5 F5 F5 F5 F5 F5 F5 Constant browser refreshing F5
Automated Screenshots “Oh Wow!, Damn! We’ve been dreaming about this” -Liquid Advertising One-click screenshots of live ads delivered in PowerPoint! AdSnap
Open Workflow Advanced tools and processes that work with you
Difficulty: bridging display & search
Channel Connect for Search Manage and measure search and display from the MediaMind interface Instantly integrate with most bid management tools or search vendors Automatice and accurate de-duplication of coversion data Cross Channel Campaign Results
Validate Display Spend with Search Lift in Site Visits Increases in average order size 7x Display Only;3x Search Only Display only Search only Search & Display Chart 1 Source: Yahoo!/Comscore Research Online, Buy Offline study, 2007 Source: Microsoft Advertising and Comscore case study (M&F 30+, 11M unique users, 52M impressions) Chart 2Source: Yahoo!/Comscore Close the Loop study, 2006 Source: Microsoft Advertising and Comscore case study (M&F 30+, 11M unique users, 52M impressions)
Difficulty: the rightad to the rightperson therighttime
Targeting and Sequencing £ $ • Rotate your rich and standard ads, as well as messages to ensure the best user experience • Set to auto optimize by any metric • Frequency cap by time, placement, and day-part € Control the sequence,rotation and frequency of your ads Save serving cost and get better performance
Difficulty: getting your data where you want it
fluid integration Open API
A Global Solution Vanessa Keller Manager Campaign Execution, NY Kamalan Moodley London Guy Meiri Hamburg Team Leader Client Service, UK Paris Boston Software Engineer 2nd Tier Support, Israel Amsterdam Chicago New York San Francisco Madrid Bucharest Lahore Portugal Beijing Rome Los Angeles Dallas Athens Tokyo Guangzhou Houston Tel Aviv Hong Kong Mexico City Taipei Haidarabad Bangkok K. Lumpur São Paulo Singapore Sydney Cape Town Adrian Lee Team Leader Account Management, Australia
A Robust Solution Advanced Targeting/ Sequencing Global Campaign Management Billing Connect API Channel Connect for Search Channel Connect for Mobile Mass Creation Standard Banner 1-Click Reporting Ad Snap Smart Versioning Campaign Monitor Excel Trafficking Excel Plug-in Rich/Standard Optimization Workshop for Flash Custom Report Services/Builder Quick Access Tools Report Generator Advanced Preview Universal Tag Data Feeds
More Information email: ross.mcnab@eyeblaster.com phone: +1 646 202 1328 @eyeblaster @creative_zone