Download
1 / 49
490 likes | 582 Views
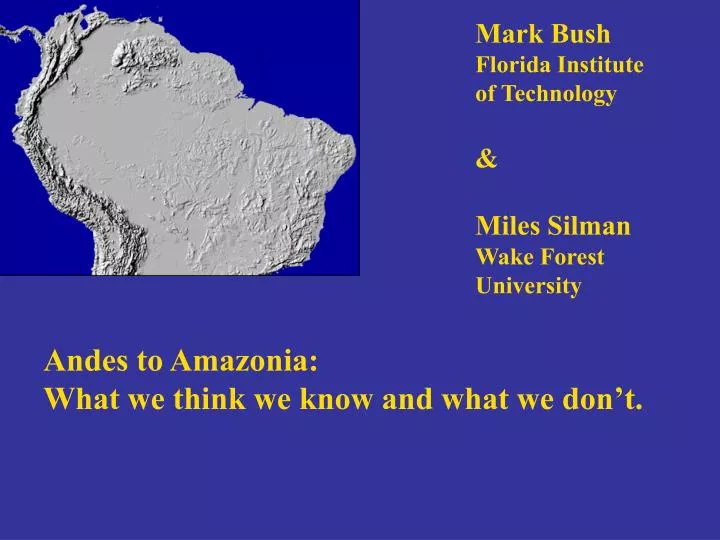
Mark Bush Florida Institute of Technology & Miles Silman Wake Forest University. Andes to Amazonia: What we think we know and what we don’t. Some of the big questions before us: To what extent can Andean records inform us about Amazonia?

E N D
Mark Bush Florida Institute of Technology & Miles Silman Wake Forest University Andes to Amazonia: What we think we know and what we don’t.
Some of the big questions before us: To what extent can Andean records inform us about Amazonia? How much climatic variation was there within ice age Amazonia? How robust are the data for a 5oC cooling in the terrestrial Neotropics? How dry was Amazonia during the last ice-age?
Refugia • Raised on modern biogeographic data but no reliable paeleocological data. • Most recent manifestation is untestable as it has no time or habitat constraints (Haffer and Prance Amazoniana 2002). Brown (1991)
Dry Forest Arcs • Modern biogeographic data used to suggest the presence of a past habitat bridge of dry forests. • Assumed to be ice-age • But there is no basis for this assumption. • Nor a real difference from modern required to allow movement of species. Pennington et al. ( J. Biogeogr. 2000)
Different ideas about Arcs Wüster et al. (Molec. Ecol. 2005) Pennington et al. (J. Biogeogr. 2000)
Sites that we’ll discuss Amazon fan Pata & Verde Maicuru Negra Carajas Consuelo Titicaca
TRMM data and paleo locations • Not surprising that the different paleoecological records are providing a different story
Late Glacial and Holocene Vegetation from Lake Titicaca Paduano et al. (Palaeo3 2003)
The Glad 800 drill rig (NSF/ODP) was hauled to Titicaca in 2001 and three cores were raised from deep water under the supervision of Paul Baker, Geoff Seltzer and Sheri Fritz.
Long record from core LTO1-2B, Titicaca Probably four, full glacial cycles. MIS 5 Pollen concentration is a proxy for productivity, and indicator of near Holocene temperatures. MIS 7 MIS 9 MIS 11
Long record from core LTO1-2B, Titicaca Too cold for pollen or Isoetes Isoetes may be important for glacial temperature. MIS 5e MIS 7 MIS 9 MIS 11
D-O cycles in Titicaca Work in progress
Titicaca pollen concentration D-O cycles in Titicaca GISP Work in progress
Lake level and insolation • Lake Titicaca and the Salar de Uyuni, Bolivia, respond to DJF insolation. • Lake level at Titicaca varies synchronously with Pata for the last 70,000 years. 20 40 K yr BP Baker et al. (Science 2001)
Lake level fluctuation in Amazonia • Lakes Pata and Verde show continuous forest cover through last two glacial periods. • Periods of low lake level correlate with periods of high K+ concentrations in sediment in Pata. • Low lake level due to reduced precipitation.
Lake level and orbital forcing • Peak low-lake level corresponds to 11 K BP and 33 K BP with 22 K BP wet (matches Titicaca). • Aligns to orbital rhythm of variation in insolation. • Continuous forest cover suggests decrease in precipitation in the wet season rather than dry season. Bush et al. (J. Paleolimn. 2002)
Lake Pata, Brazil Cal BP 10, 000 18,000 22,000 34,000 48,000 Colinvaux et al. (Science 1996)
Linking Amazon and Andean forests Single system Space and Time Fully vouchered 1 ha plots lowlands to treeline (17 to date) Series of lakes along transects Peru and Bolivia Andes Biodiversity Consortium
Modern Ecology: 77 ha (Peru) -17 Montane, 60 Lowland w3tropicos database Paleoecology: 24 Lakes L L L L L L L L L L L L L L L L L L L L L L L L L L L
Continuous wet forest taxa for 50,000 yrs Gradual change in community composition Representation of pollen taxa Bush et al. (Science 2004)
Consuelo Ordination Two basic states • 30 kyr • 11 kyr Evidence of cycles
Two major forest types Periodic changes ENSO, drought cycles, D-O events Gradual ~8-10 ky transition Non-equilibrium? DCA Axis 1 vs. Time
~1200m 0.0055 °C m-1 ~6.6 °C cooler Elevation for taxa found 21,000 years ago (500 cm pollen assemblage) If taxa were found co-occurring today, most likely elevation would be 2400m Q: What does time course look like?
Dry event Laguna Negra wavelets Lake at 3300 m elev, 7oS. Bush et al. (JQS In press)
Consuelo and Pata Pata
Maicuru 15-30K hiatus Colinvaux et al. (Amazoniana 2001)
Carajas, eastern Amazonia 15-25K hiatus 15,000 25,000 31,000 >50,000 Absy et al. (Compt Rendus 1991)
Amazon Fan data (S. Haberle 1999) Modern Grass Fan deposits reflect pollen from entire basin Ice age does not have more grass pollen than modern Ice age Grass
Plants probably respond to minimum temperatures, and absolute modern minima are very different across the basin. Were absolute minima in the north reduced while monthly minima were reduced in the south? 13oC 8oC What is cooling? All these sites provide evidence of a 5-7oC cooling at the LGM
One way forward: Improving pollen recognition Using SEM and vector- based computer modeling we aim to improve identification of key taxa to species or species group. More precise taxonomy = more precise bioclimatic envelope modeling Extract sub-region for training and recognition
What we think we know: • Strong decline in species diversity with elevation. • Species migrate individualistically in response to climate change. • Strong cooling signature in all Pleistocene records with some species’ ranges typically moving 1000 m -1500 m downslope. • Lowland taxa are adapted to Pleistocene cooling. • Amazonian paleoclimates were temporally and spatially heterogeneous. • Refugia and savanna corridors are not grounded in reality.
What we don’t know: Do we have to reconcile the terrestrial record with the marine record? Difference in temperature could be absolute minima (NH) or mean temperature (SH)? To what extent forest structure changed. Fine-resolution climate change from the lowlands. The full impact of Holocene human activities.
Jen Hanselman The Coring Gang Alex Correa Dunia Urrego Andrea Gomez Dr. Will Gosling