Download

1 / 7
70 likes | 79 Views
Exponential growth and d ecay. … where A, b and k are numbers depending on the given situation. For example, we saw that when A = 920, b = 1.017 and k = 1, we had the bank balance (y) of an initial £920 that has an interest rate of 1.7% at a given time (x).

E N D
… where A, b and k are numbers depending on the given situation. For example, we saw that when A = 920, b = 1.017 and k = 1, we had the bank balance (y) of an initial £920 that has an interest rate of 1.7% at a given time (x). The function of growth and decay
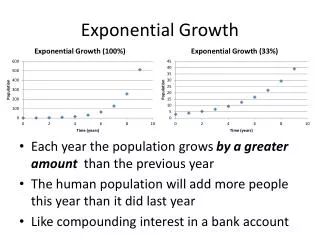
How does changing the value of A, b and k change the shape of the graph? Which represent growth, which represent decay? What scenarios relate to these graphs? Sketch the graph you’ve been given and conclude on these. Changing shape
The bigger the magnitude of A, the bigger the gradient of the curve. The value of A is the y-intercept and represents the initial quantity of y (when x=0) Negative values of A result in the curve bending in the opposite direction. Changing A
The bigger the magnitude of b, the bigger the gradient of the curve. If b > 1, the graph represents growth. If b = 1, the graph represents a constant value. If 0 < b < 1, the graph represents decay. Changing b
The bigger the magnitude of k, the bigger the gradient of the curve. If k > 0, the graph represents growth. If k = 0, the graph represents a constant value. If k < 0, the graph represents decay. Changing k